
Where The Economy Stands For 2018
The market has certainly gotten a bit rocky. They say November is historically a strong month for the markets. That’s mostly because funds are cleaning up their positions and taking new positions. That buying tends to be bullish.
I track labor metrics to understand the breadth and depth of the economy. More hiring by more companies means solid economic growth.
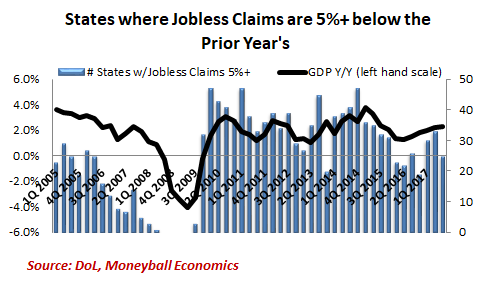
There’s a chart I put together which expresses the relationship between Jobless Claims and US GDP.
First, let me explain the concept – because I created it and it’s not widely known.
The premise is basic – companies hire and fire based on their business activity compared to the prior year. If Acme did $1 million (M) in business last year and they expect to do $1.1M this year, then they hire more.
Next, I take that year-over-year (yr/yr) measurement in Initial Jobless Claims.
When this year’s claims are below last year’s then the economy is expanding.Turned around, when companies are firing fewer workers, it’s because they have more business.
But there’s a threshold level. Historically, when that yr/yr gap is >5%, the economy is growing.
Once that gap shrinks to <5%, economic growth is about to flatten. When that gap disappears altogether and more people are being fired this year versus last year, then growth is contracting. Now, that’s a rule of thumb. And there are some nuances. But the chart is very revealing. The most important nuance to take note of is breadth: how many States are in the 5% zone. For example, a hurricane can push up claims and make that headline Jobless Claims figure a problem. So I measure how many States have a y/y claims level that is >5%.
And this is what I see:
Look at the run-up to the recession in 2007. The tipping point came in late 2016 when we started to see that the minority of States continued to have Jobless Claims below the prior year (technically at least 5% below the prior year).


Leave A Comment