
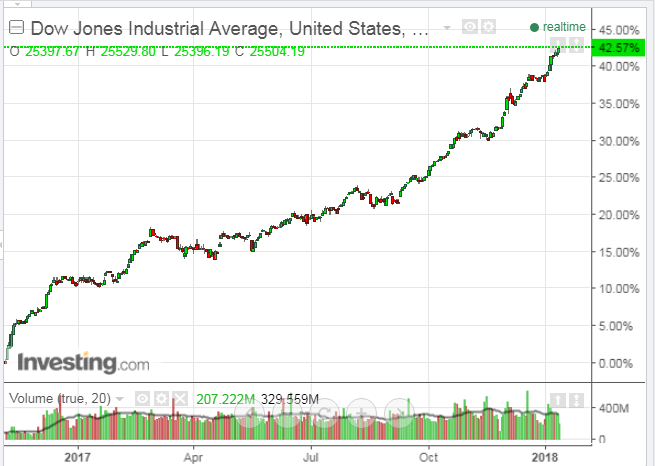
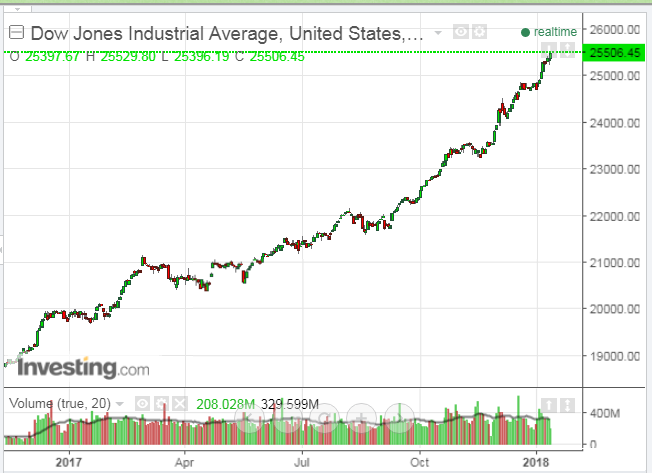
Since the December 8, 2016 U.S. Presidential election, the Dow 30 Index has gained around 42.57%, as of 2:00 pm ET today (Thursday). It also crossed above a new all-time high of 25,500, as shown on the two Daily charts below.
The following Monthly chart shows that price is trading in between support (25,125) and resistance (26,702), namely two external Fibonacci retracement levels.
Of course, anything can happen in between these levels, but they may play an important role in the days/weeks ahead…ones to watch, especially 25,125.


Leave A Comment