
While the bears contend that the market is ripe for a spill, so far at least, sideways appears to be the new down. For example, the S&P 500 has been moving sideways since mid-February and closed Friday just 1.68% off the March 1 all-time high. However, with questions about the Fed’s next move, valuations at lofty levels, and some of my favorite long-term indicators waving yellow flags, some caution appears to be warranted. My apologies for sounding like a broken record here, but keep in mind that weakness in the indicators is often a precursor to meaningful corrections. Yet, at the same time, it is important to note that these types of warning signs can often be quite early.
But before we get ahead of ourselves, let’s start the week with an objective review the key market models and indicators. To review, the primary goal of this exercise (something I do on a daily basis) is to remove any preconceived, subjective notions about the markets and ensure that I stay in line what “is” really happening in the market. So, let’s get started…
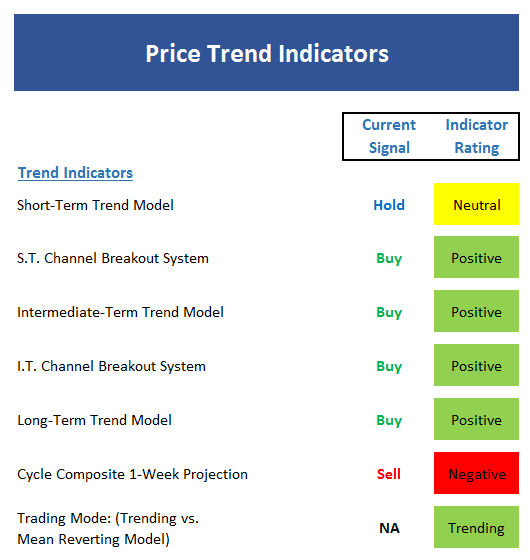
The State of the Trend
We start each week with a look at the “state of the trend.” These indicators are designed to give us a feel for the overall health of the current short- and intermediate-term trend models.
Executive Summary:


Leave A Comment