by Pat Reilly, FactSet
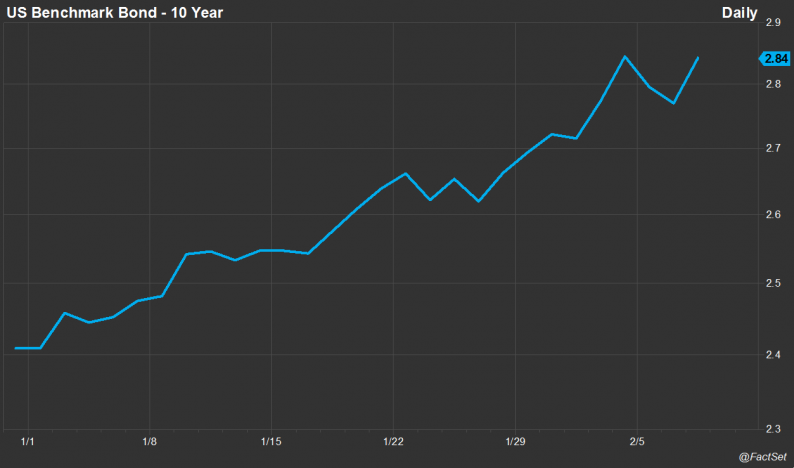
We are now a week into February and I feel safe exclaiming “wow, I didn’t see that one coming!” The chart of the 10-year Treasury looks like the front range of the Rockies, jumping 31 basis points in January and continuing to climb another 14 basis points through Wednesday’s close. Concurrently, the S&P 500 has given back all the gains from the best January in 20 years and the VIX is flashing at levels not seen since the Taper Tantrum. Attitudes tend to vary from the apocalyptic to panic and dread to hopelessness and acceptance depending on your preferred news outlet.

In fact, it seems like you can’t have a macro conversation without hearing “this time is different” or that we’re seeing a “new normal.” But is it the end of the (fixed income) world as we know it? I would emphatically say “no!” for three primary reasons. First, moves of this scale are not uncommon; volatility was never extinct. Second, there are massive holders and buyers of fixed income who do not mark to market and benefit from an increase in interest rates. Finally, as the Fed progresses through a tightening cycle, it is possible to project potential total returns and take steps to mitigate undesirable outcomes.
Bond Market History Lesson
It is undeniable that this type of move in rates is painful; however, it is more common than you would think. Looking at monthly moves in the 10-year treasury over the past 30 years, we observe absolute month-over-month moves greater than 30 basis points more than 25% of the time. Put another way, the average absolute monthly move over that timeframe is 21 basis points. We experienced moves of this scale 147 times, or 40% of the time. Like sun in London, it’s a surprise, but not all that uncommon.


Leave A Comment