
Why Has Labor’s Share of Gross Domestic Product (GDP) been declining for 40 Years? The question cuts right to the heart of the core socio-economic issues of our era: the decline of secure work and the explosive rise of wealth and income inequality.
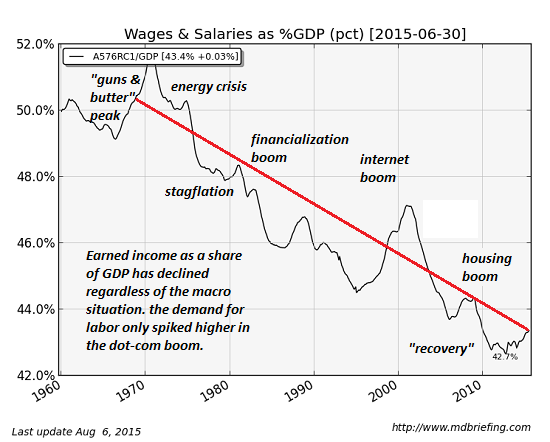
(chart courtesy of mdbriefing.com)
Over time, economic trends typically reflect macro conditions such as productivity, cost of energy, percentage of the adult population in the work force, etc.
For example: when oil shoots up in price, recessions follow. This is an obvious and well-supported correlation: when households have to spend more income on fuel, they have less to spend on other stuff, and that decline in spending pushes the economy into recession.
But labor’s declining share of GDP hasn’t reversed course as macro conditions change; labor’s share keeps dropping, with brief periods of gains that quickly melt back to the downward-sloping trend line.
Other than the brief 5-year dot-com boom of 1995-2000, labor’s share of GDP has dropped for four decades, through recessions and booms alike.
Why does this matter? If wages and salaries–earned income–is a steadily decreasing share of the entire economy, this means household earned income is eroding even when the economy is expanding.
And this is precisely what we see now: household income actually declined 8.5% since 2000 when adjusted for inflation.
How can households pay rising taxes, borrow more money and spend more to support a consumer economy on an income that’s shrinking even when the economy is expanding?
Answer: they can’t. “Something’s gotta give”: they can’t pay higher taxes, borrow more money (and incur more monthly payments) and spend more on goods and services when their incomes are stagnating. It simply isn’t possible.
Interestingly, labor’s share of GDP only rose in the brief periods when labor was in strong demand:
1. in the late 1960s “guns and butter” era of Vietnam era military spending and new social-welfare programs


Leave A Comment