
Previously, in looking at the total market cap of the new homes sold in the United States, we found that the market for new homes in the U.S. began to noticeably decelerate after September 2016.
Since market capitalization is the product of both new home sale prices and the quantity of new home sales, to find out why that outcome is happening, we first looked at the trailing twelve month average of new home sale prices. The following chart shows the most recent major trends in median new home sale prices in the period from July 2012 through January 2017.

In this chart, we see that after having risen at a relatively slow pace in the months from August through October 2016, they briefly dipped in November 2016, before rebounding to rise at a somewhat faster pace than they had in the months preceding November 2016.
But since the market cap was falling from October 2016 onward, that combination can only mean that the number of new homes being sold was falling more sharply than their sale prices were rising. And sure enough, we do see that after spiking in July 2016, the number of new home sales was rising slowly up to November 2016, after which they dropped sharply in December 2016.

Before we continue, we should note that the most recent three months of data shown in the charts above are still subject to revision, so the price and quantity data for new home sales during the months of November 2016, December 2016 and January 2016 may all change during the next several months.
Back to the topic at hand, one obvious candidate to consider that could potentially explain what we see in both the price and quantity data for new home sales is mortgage rates. The following chart shows how the average interest rates for conventional 30-year have changed from month to month from July 2012 through January 2017.
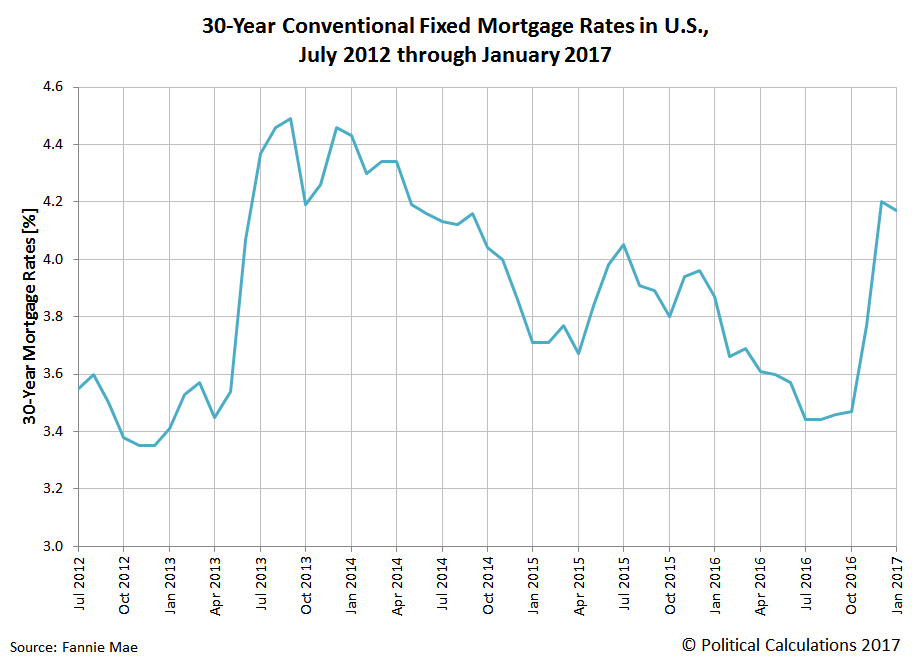
In December 2016, the average 30-year fixed interest rate mortgage in the U.S. rose by 0.43 points to 4.20% from the previous month, which just happened to be nearly three-quarters of percentage higher than where it had bottomed in July and August 2016.


Leave A Comment