Well, no one can say there’s been a shortage of coverage when it comes to suppressed vol.
Indeed, the extent to which this market is “volatility-less” has grabbed quite a few headlines as everyone attempts to solve a mystery that may be no mystery at all. That is, low realized vol begets low implied vol and the Trump trade telegraphed clear winners and losers leading directly to plunging stock and sector correlations so you know… what’s with the whole “mystery” meme?
Anyway, this is one of those topics that you kind of have to mention every once and a while because people like it – and we aim to please.
Specifically, we noted the following from Goldman:
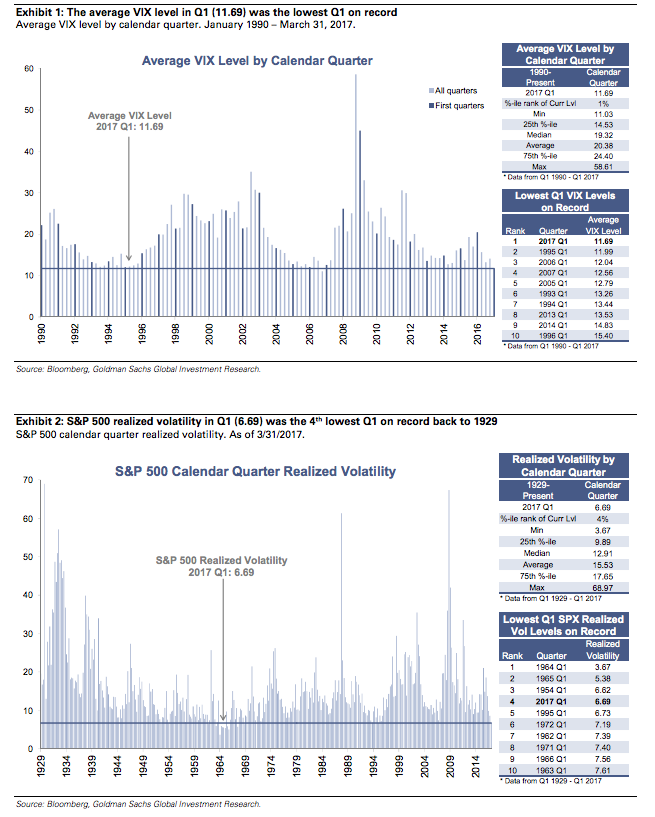
Lowest Q1 VIX level on record
- Despite a quarter characterized by elevated policy uncertainty and an intense focus on tax reform, infrastructure spending and deregulation, U.S. equities had one of their lowest volatility quarters on record.
- The average VIX level in Q1 was 11.69, the lowest first quarter in VIX history. Low volatility levels were persistent, with the VIX trading in a tight band between 10.6 and 13.1 over the first quarter.
- If we include all calendar quarters, Q1 2017 was the second lowest quarterly average VIX level back to 1990; only ranking behind Q4 2006, when VIX averaged 11.03.

Well, given the fact that it looks like conveniently-timed VIX crushes are set to play an increasingly important role in supporting this market now that the USDJPY ignition mechanism and 10Y yields are at least temporarily (and perhaps permanently) sidelined, we thought readers might like a little nuance with their vol analysis. Read below as Deutsche Bank takes a granular look at “hibernating” volatility.
Via Deutsche Bank


Leave A Comment