
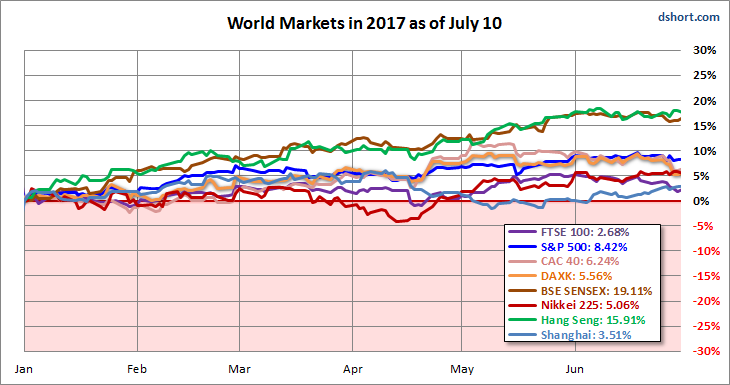
All eight indexes on our world watch list have posted gains for 2017 through July 10. The top performer thus far is India’s BSE SENSEX with a gain of 19.11%, followed by China’s Hang Seng not far behind at 15.91%. In third is our own S&P 500 with 8.42%..
The Last Four Weeks
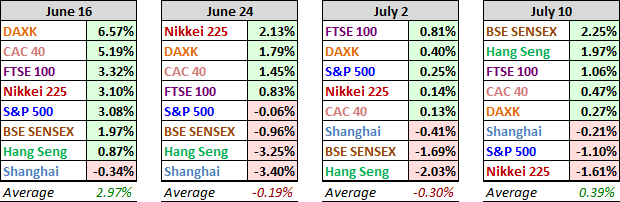
The tables below provide a concise overview of performance comparisons over the last four weeks for these eight major indexes. We’ve also included the average for each week so that we can evaluate the performance of a specific index relative to the overall mean and better understand weekly volatility. The colors for each index name help us visualize the comparative performance over time.
2017 YTD Performance
Here is an overlay of the eight illustrating their comparative performance thus far in 2017.
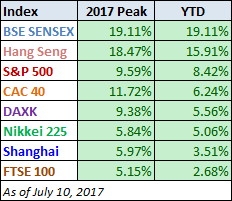
Here is a table of the 2017 performance, sorted from high to low, along with the most recent highs for the eight indexes. All eight indexes have posted 2017 gains, India’s BSE SENSEX with a gain of 19.11%, followed by China’s Hang Seng not far behind at 15.91%. In third is our own S&P 500 with 8.42%. In last is the London Stock Exchange (FTSE 100) at a measly 2.68%.
Bear Market Perspective
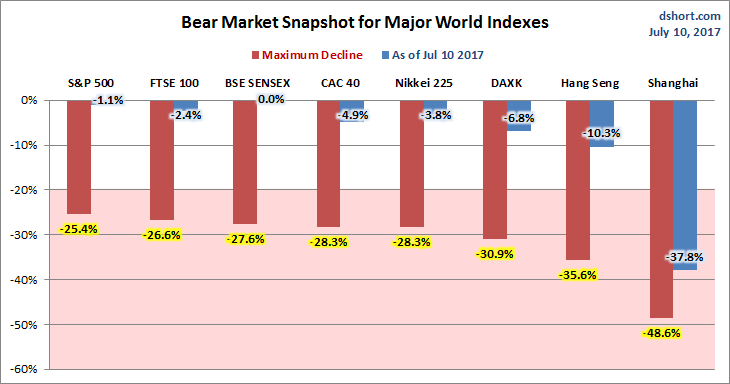
The column chart is sorted by the least to worst declines from previous peaks as of the week’s end. Seven of our eight watch list indexes had dropped into bear territory (a 20% decline), the S&P 500 being the sole exception. As of the latest close, one index is in the bear zone, unchanged from the previous week.
A Longer Perspective
The chart below illustrates the comparative performance of World Markets since March 9, 2009. The start date is arbitrary: The S&P 500, CAC 40 and BSE SENSEX hit their lows on March 9th, the Nikkei 225 on March 10th, the DAXK on March 6th, the FTSE on March 3rd, the Shanghai Composite on November 4, 2008, and the Hang Seng even earlier on October 27, 2008. However, by aligning on the same day and using a log scale vertical axis, we get an excellent visualization of the relative performance. We’ve indexed each of the eight to 800 on the March 9th start date. The callout in the upper left corner shows the percent change from the start date to the latest weekly close.


Leave A Comment