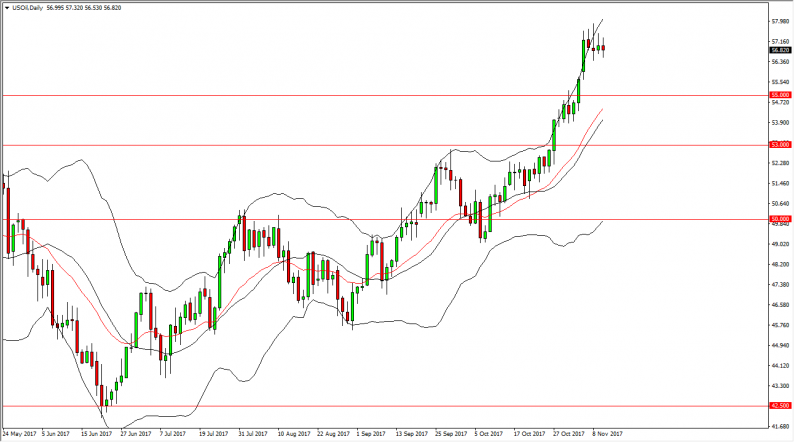
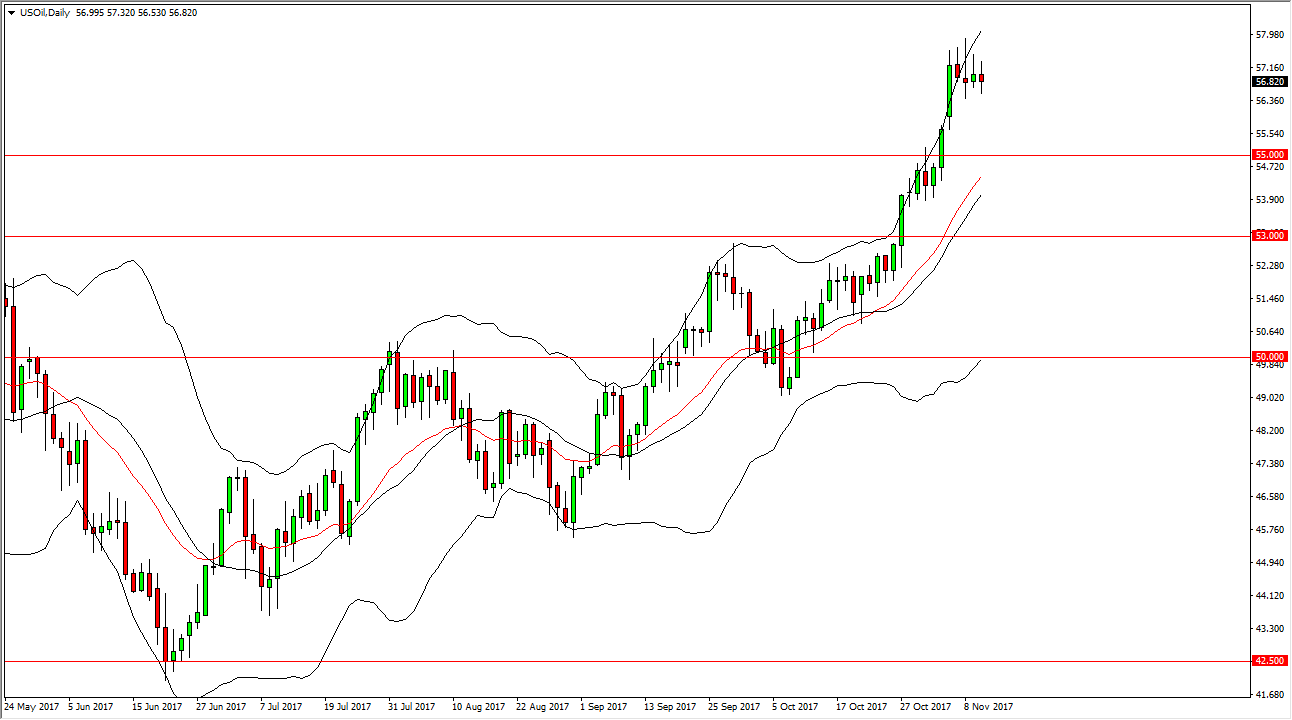
WTI Crude Oil
The WTI Crude Oil market did very little during the trading session on Friday, as we continue to hover around the $57 level. I think that if we pull back from here, there should be plenty of support underneath, especially near the $55 level. The market has been a bit overextended, so it makes sense that we may have to drop back to find the value necessary to continue the overall uptrend. If we were to break down below the $55 level, there should then be support at $53. I have the Bollinger bands attached to the chart, and we have recently pierced the overbought region as well, giving us yet another reason to think that a pullback might be imminent. Expect volatility, but quite frankly any pullback at this point should end up offering value.
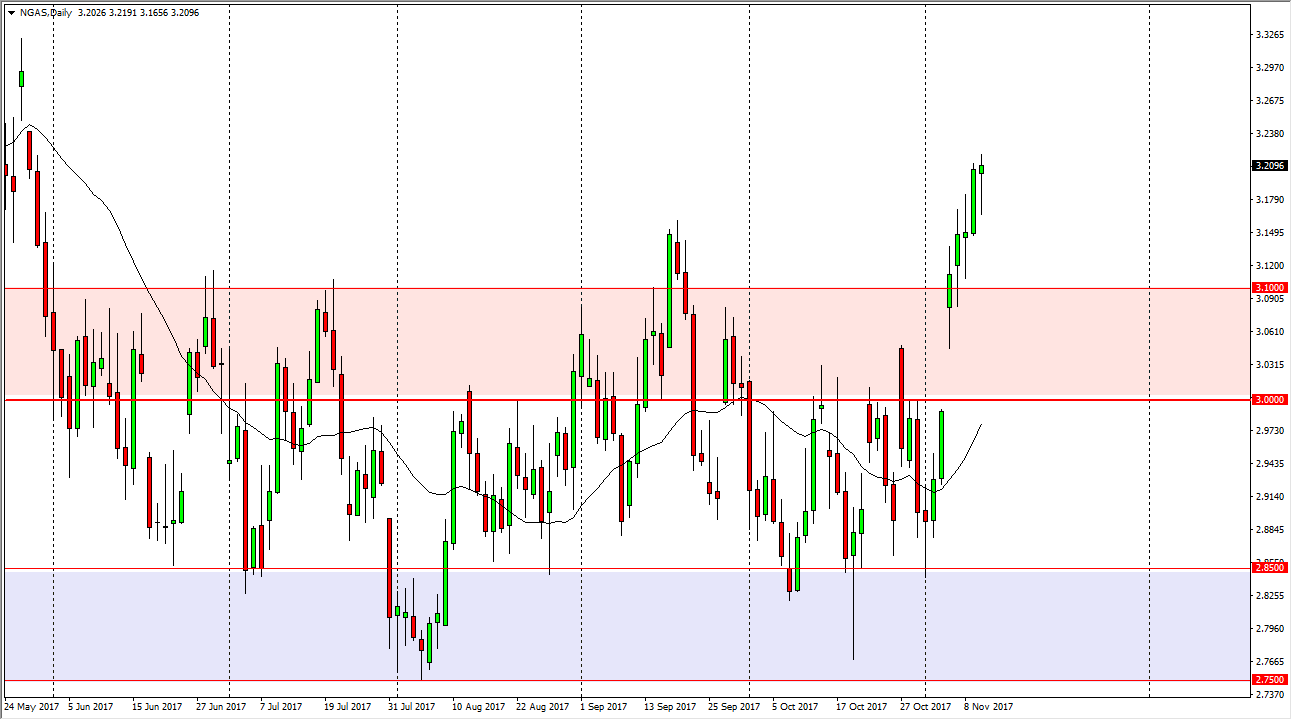
Natural Gas
Natural gas markets fell initially during the trading session on Friday but then turned around to form a massive hammer. The hammer of course is a bullish sign if we can break above the top of that we should continue to go higher. Alternately though, if we were to break down below the bottom of the hammer it technically then becomes a “hanging man.” That is a very negative sign and should send this market down to the $3.10 level, and then perhaps even down to fill the gap at the $3.00 level. In general, that should end up being a buying opportunity though, because we are getting colder temperatures in the United States and we are getting closer to the seasonality of higher pricing anyway. For the next couple of months, natural gas looks likely to find buyers on pullbacks, and of course breakouts to the upside. In general, I believe that this market will go higher over the next couple of months, only to roll over again in the beginning of next year.


Leave A Comment