
The start of April has oil traders and investors wondering if Q2 will align with the second half of Q1. After hitting a current low on February 11, Oil moved higher by ~61%, and it’s unclear if we won’t see more gains this quarter. Since Mid-March, Bears have rejoiced on the recent pullback, but as you’ll see below, there appears to be an array of support that could be ready to launch oil further into a Bull Market.
A recent flow of funds indicator helped to show why oil corrected nearly 11% at the end of March. Fund flows from the most popular ETF, the United States Oil Fund or USO, showed its largest monthly outflow in 5 years in March. The small pullback in light of such a large outflows, nearly $600M could be seen as a sign of resilience for oil Bulls. Of course, if the outflows continue, then we’d likely fail to make another push toward the 200-DMA, and we could soon see a retest of ~$30.
Learn more about the breakdown of oil production – click here.
Outside of the market dynamics, an interesting confluence of technical support appears to be holding up price right now. If these indicators and tools continue to hold up the price, we may be on the cusp of another large move higher in % terms in WTI Crude Oil.
Confluence of Support Aligning Under Current Price
To See How FXCM’s Live Clients Are Positioned In FX & Equities Click Here Now.
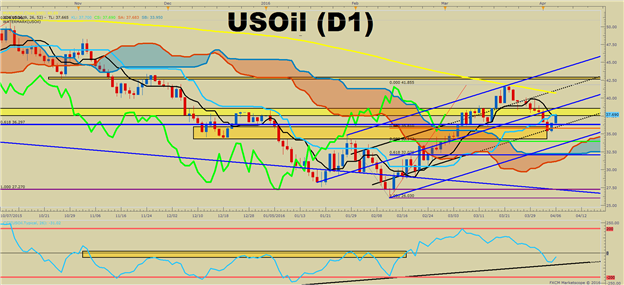
The first easy to recognize form of support is the 38.2% Fibonacci retracement level of the February – March range that sits at $35.80. While a retracement may still be in the works, the 38.2%-61.8% retracement zone is common support in a developing uptrend, and if price fails to push below this level, it may be another sign that we’re about to see another breakout.
Another encouraging sign is the potential of price to move above the Daily Ichimoku Kijun-Sen line that currently sits at $37.70/barrel. Ichimoku is a trend following trading system that allows traders to identify the larger trend at play, developing momentum, and pullback or retracement zones to get into a trade. One of my favorite signs of trend continuation is when the price is above the cloud, and crosses above the Kijun-Sen (blue line), which is the 26-Day midpoint.


Leave A Comment