
Following API’s reported massive build in crude (and draw in gasoline), DOE confirmed the extreme moves with a major 8.2mm crude build and a massive 6.56mm draw in gasoline (the biggest since April 2011). US Crude production rose once again – to 13-month-highs.
API
DOE
This is the 9th weekly rise in crude inventories (some chatter on API data including SPR barrels but that was marginal at best compared to the headline print)…The gasoline draw is the biggest since April 2011

Notably West Coast (PADD 5) CRUDE STOCKS INCREASE 4.65M BBL, MOST SINCE OCT. 1999 ..
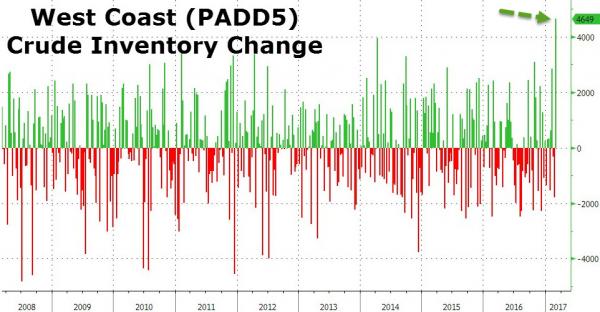
Bloomberg’s Bert Glibert notes that based on bill of lading data, the biggest sources of waterborne barrels to PADD 5 last week were Ecuadorian Napo and Kuwait Crude oil.
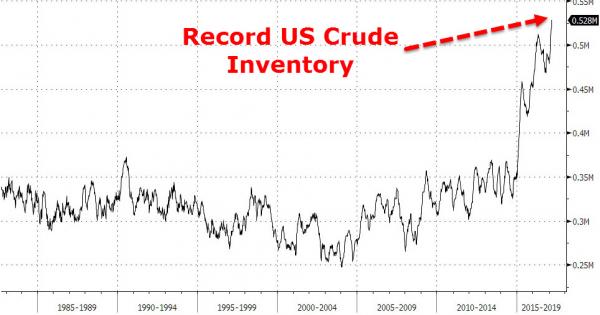
This is a new record high for US crude inventories…“Inventory drawdown slower than I thought after cuts,” Saudi Arabia’s Khalid Al-Falih admits.
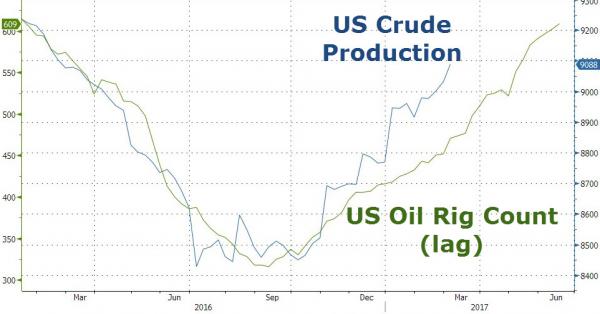
And US crude production continues to trend higher with lagged rig counts…Saudi oil minister Khalid Al-Falih had complained that “the green shoots in the U.S. are growing too fast,”
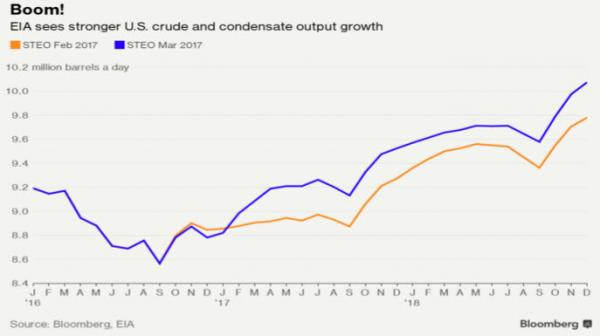
And as a reminder, the EIA published another bullish outlook for U.S. oil production in yesterday’s Short-Term Energy Outlook. It raised the 2017 year-on-year increase in crude and condensate production to 330,000 b/d from its previous assessment of just 100,000 b/d and now sees output above 10 million barrels a day by the end of 2018. Rebalancing the market is getting more difficult.
Notably the RBOB bounce (on API inventory draw) had been largely erased before the DOE data (and WTI had extended losses)…but the better than API crude build and huge gasoline draw triggered panic buying…


Leave A Comment