
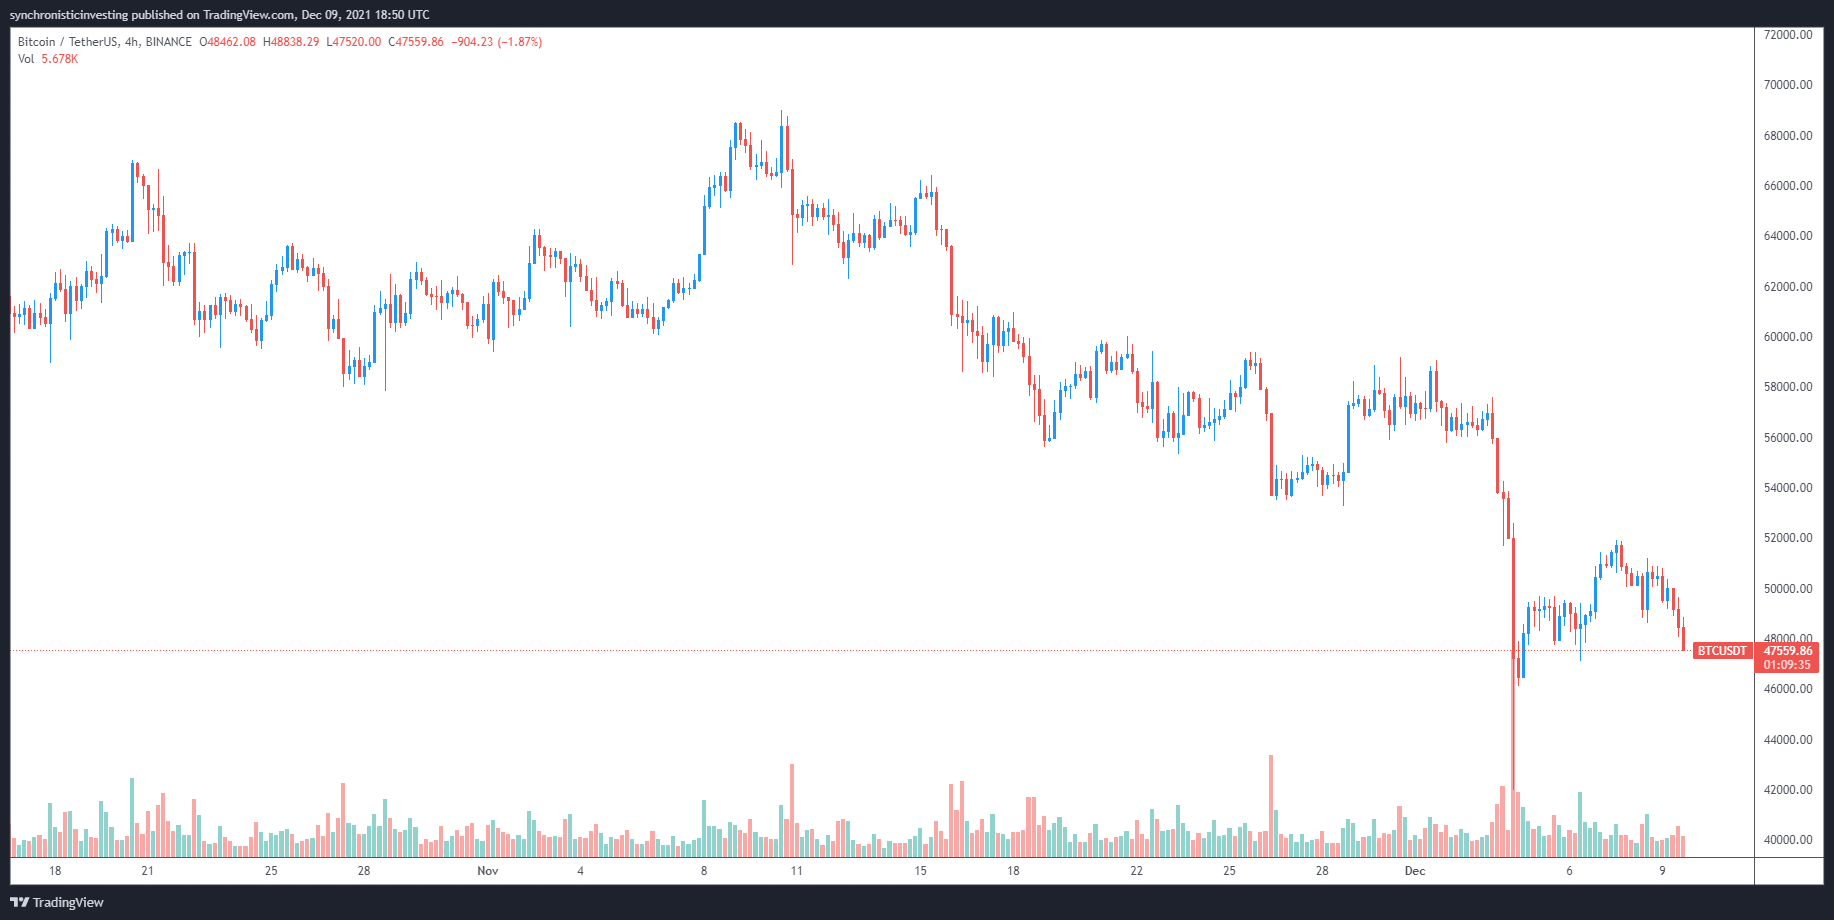
Crypto markets tanked again after Bitcoin (BTC) price slipped to $47,500 on Dec. 9, but most analysts agree that the price is destined to remain in the $40,000 to $55,000 range until the holiday season has passed.
Low bid pressure, return to neutral funding. This is starting to feel reminiscent of the price action we saw earlier this year as price bled to sub $30k.
— Ben Lilly (@MrBenLilly) December 9, 2021
Here’s a look at what analysts and traders are saying about the recent price action and whether or not BTC’s current downside is a signal that a bear market is in the making.
Bulls aim to hold the $47,000 support
Insight into the weekly price action was provided by analyst and pseudonymous Twitter user ‘Rekt Capital’, who posted the following chart outlining the levels of support and resistance that are currently relevant to the price action for BTC.
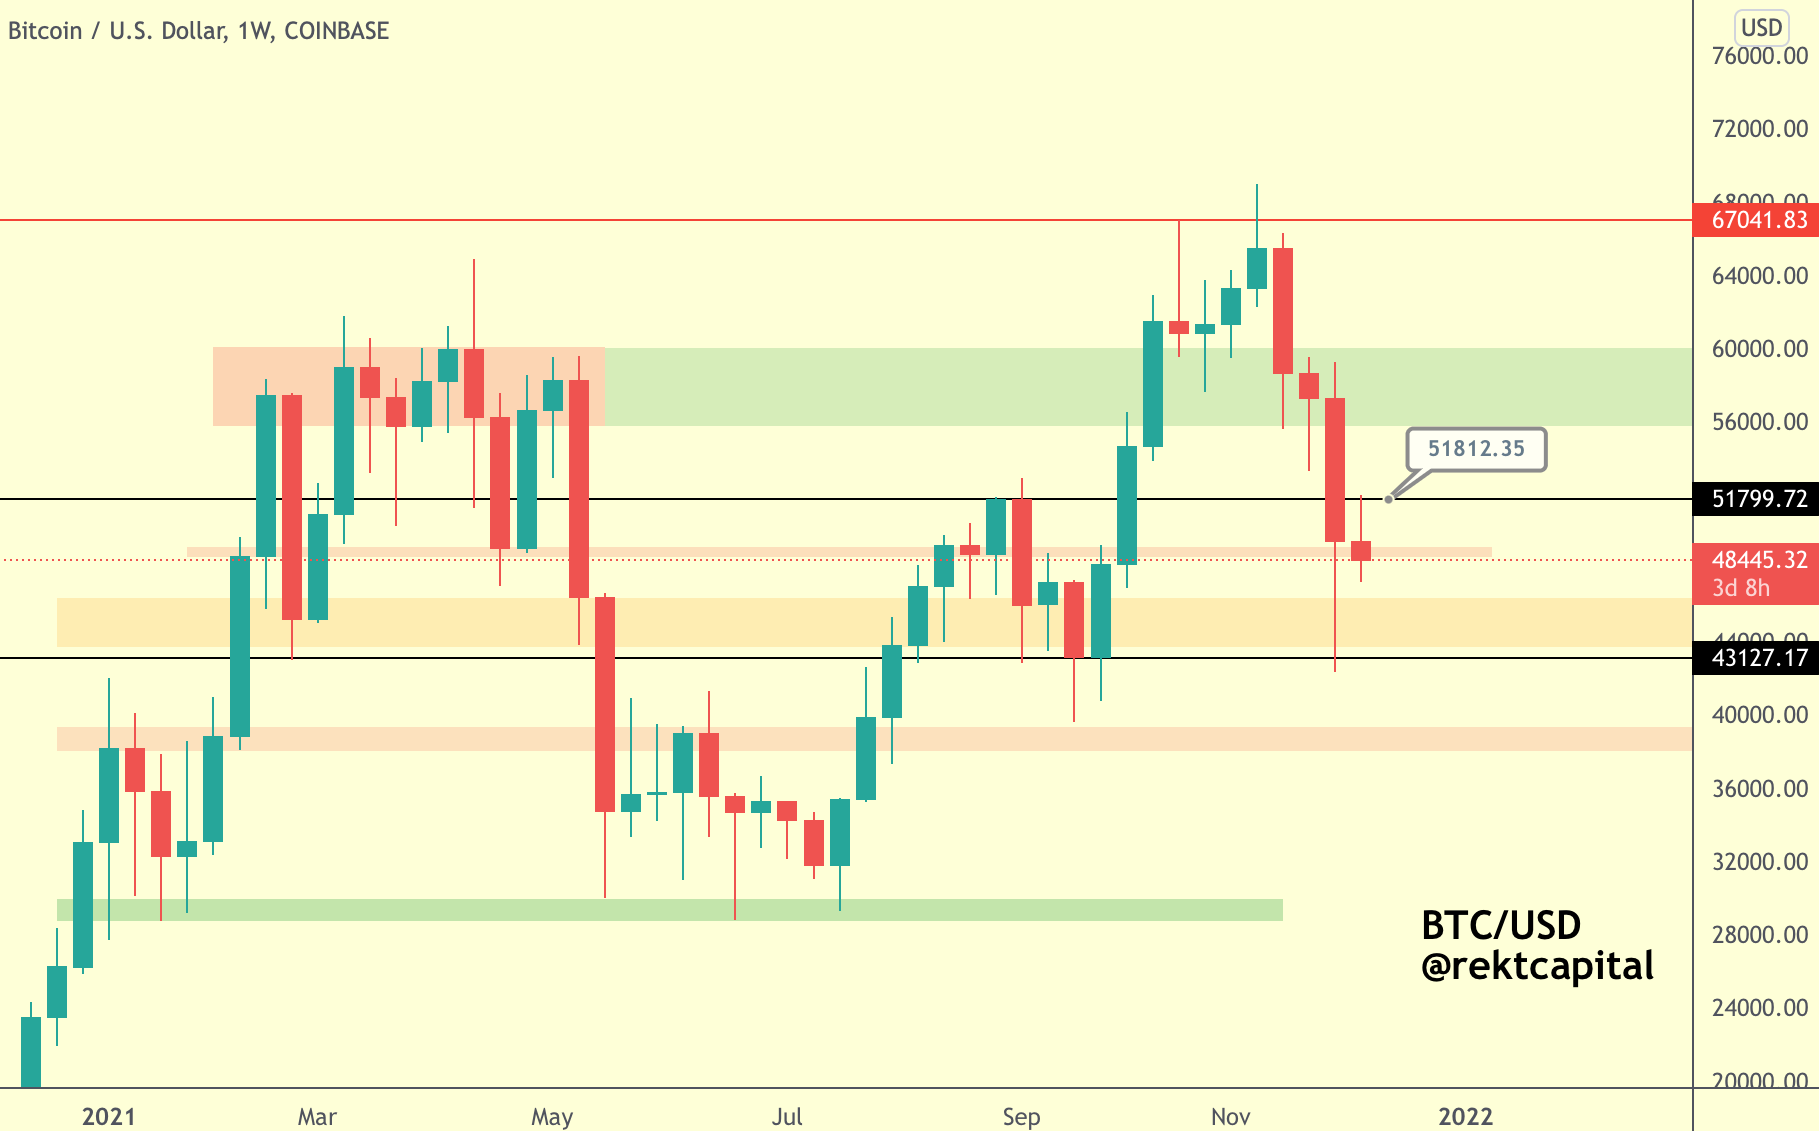
“BTC is threatening to lose this red support but no confirmed breakdown. Below red is the orange area, a strong support which ended two -25% corrections in February and September. Generally red needs to hold to avoid a drop to orange. Still holding here until further notice.”
Full-time trader and Cointelegraph contributor Michaël van de Poppe is also keeping an eye at the price action around these important support levels and posted the following chart outlining the “make it or break it” support level in the low $40,000s.
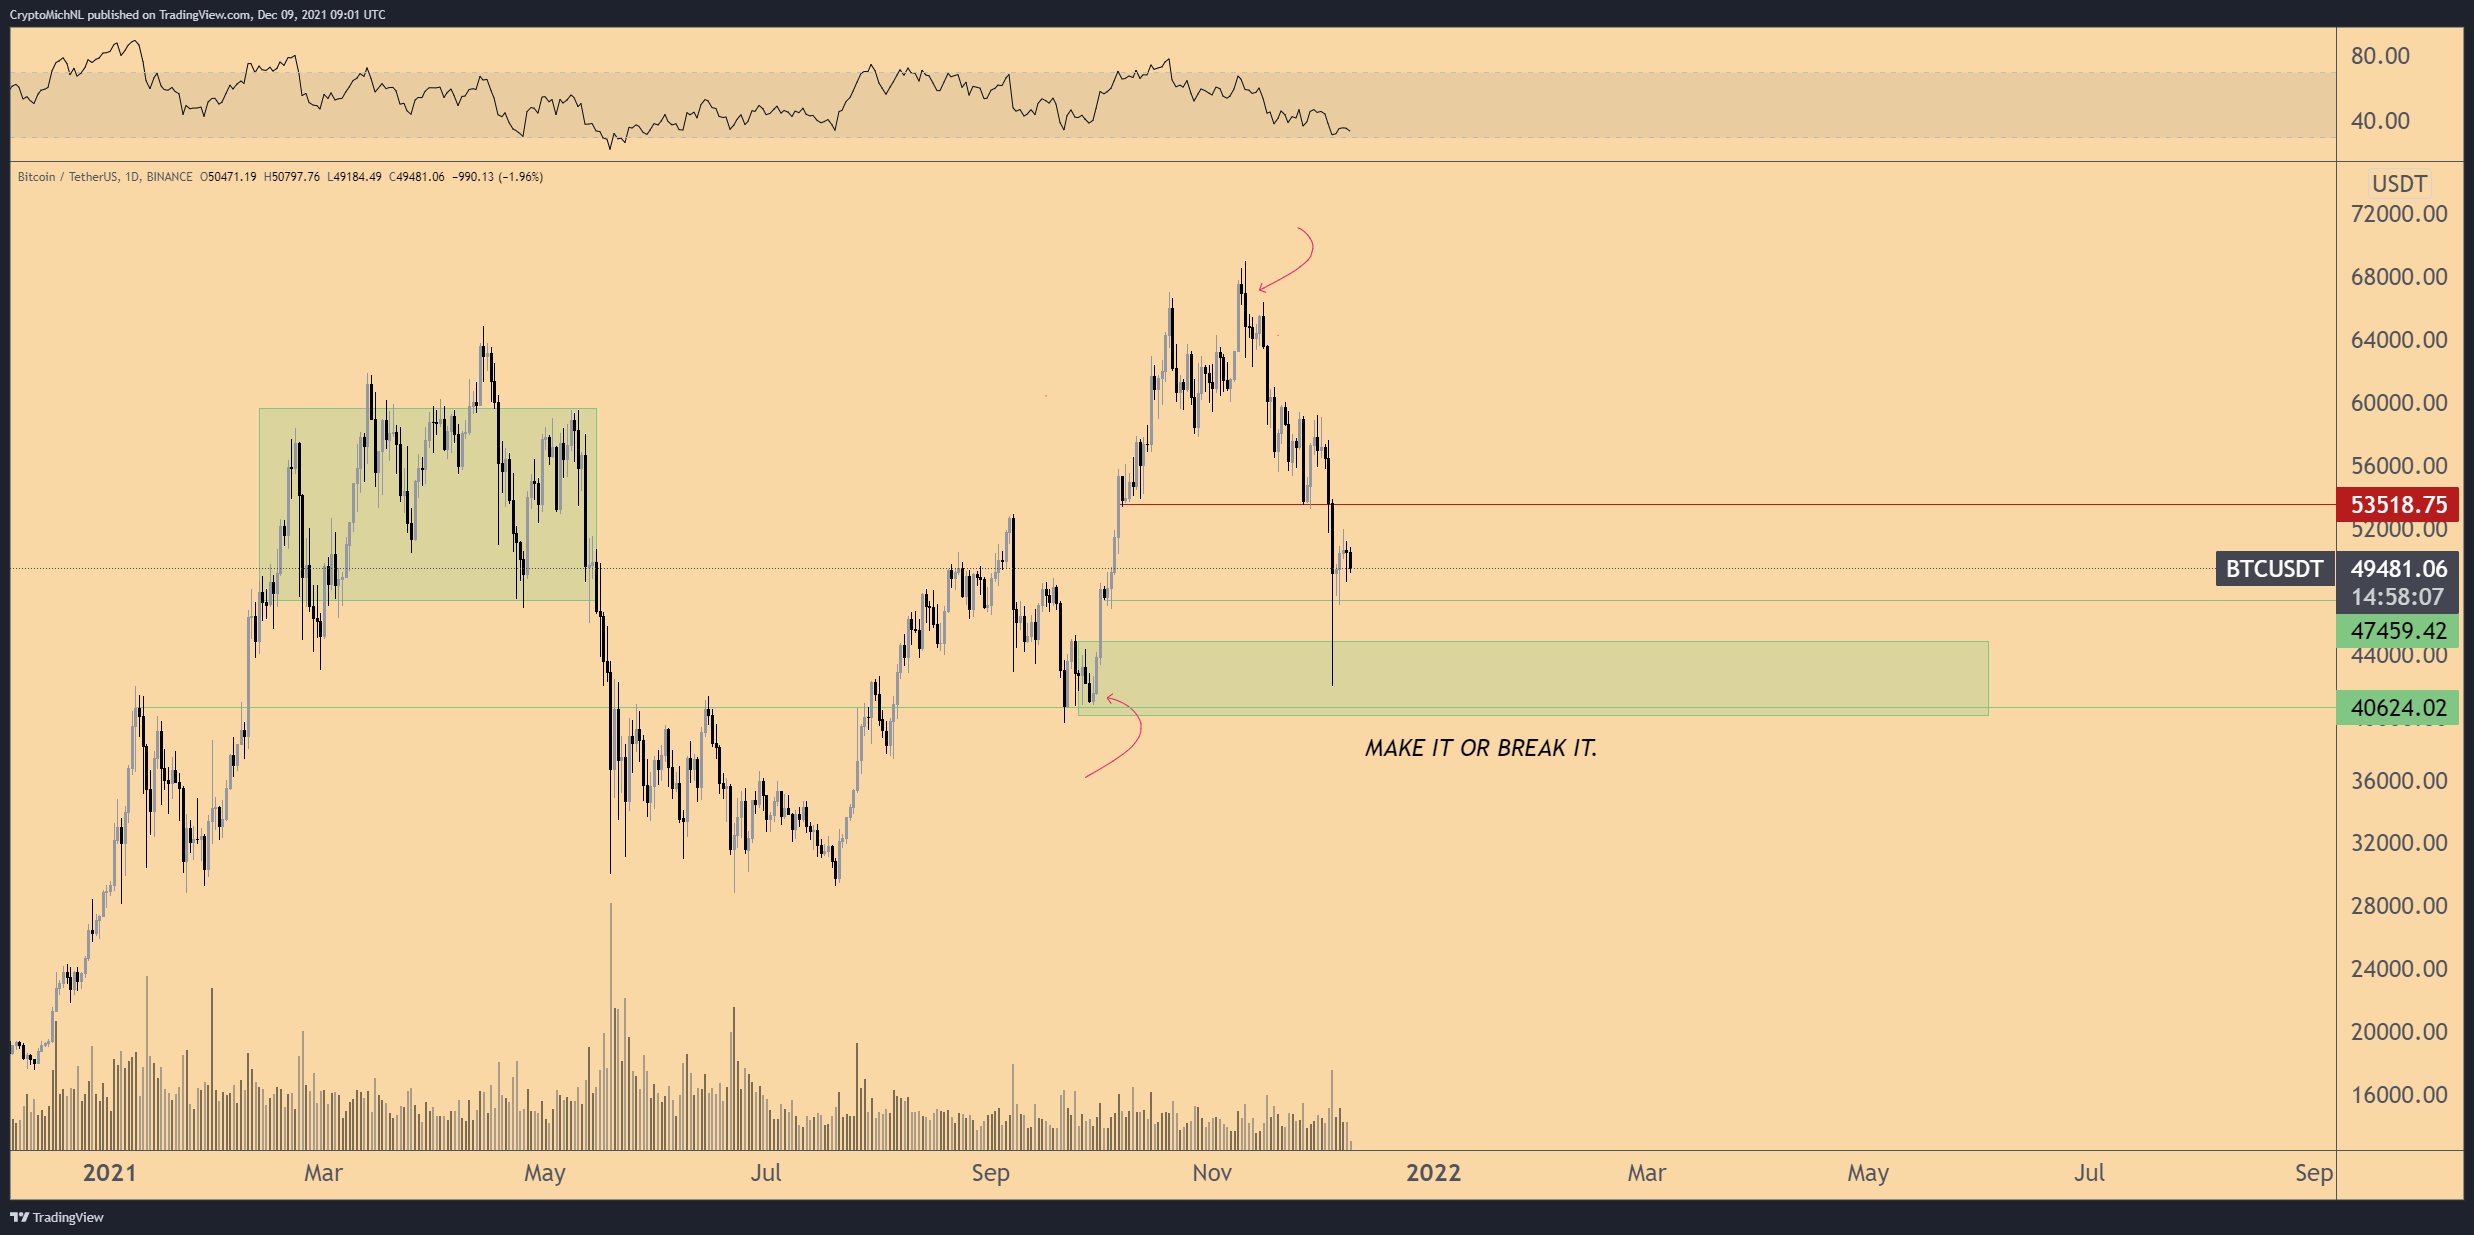
“Chop, chop, chop it is for Bitcoin. A crucial area to hold is that region we’ve touched already at $42K. The close was above $46-47K and I’d prefer not to lose that at all.”
Pennant formation hints at an eventual bounce
Further analysis on the weekly price action for BTC was provided by analyst and pseudonymous Twitter user ‘TechDev’, who posted the following tweet outlining the formation of pennants on the Bitcoin chart which have proven to be followed by bullish breakouts in the past.
Still watching this #BTC weekly pennant action.
The most bullish moves often come from testing invalidation points.
Nobody said it was easy. pic.twitter.com/AtYfYr8Ojb
— TechDev (@TechDev_52) December 9, 2021
As expressed by TechDev at the end of his Tweet, nobody ever said that making money and holding firm on the long-term outlook for BTC was easy, and the biggest rewards are reserved for those that can persevere during times of struggle like the market is currently facing.
Related: Bitcoin could hit $100K, gold $2K in 2022 thanks to ‘deflationary forces’ — Bloomberg analyst
Bitcoin price action resembles the 2017 market
A final bit of insight was offered by crypto trader and pseudonymous Twitter user ‘Nunya Bizniz’, who posted the following chart comparing the price action for BTC during the 2017 bull market cycle to the current chart and hinted at a possible breakout approaching for Bitcoin in the near future.
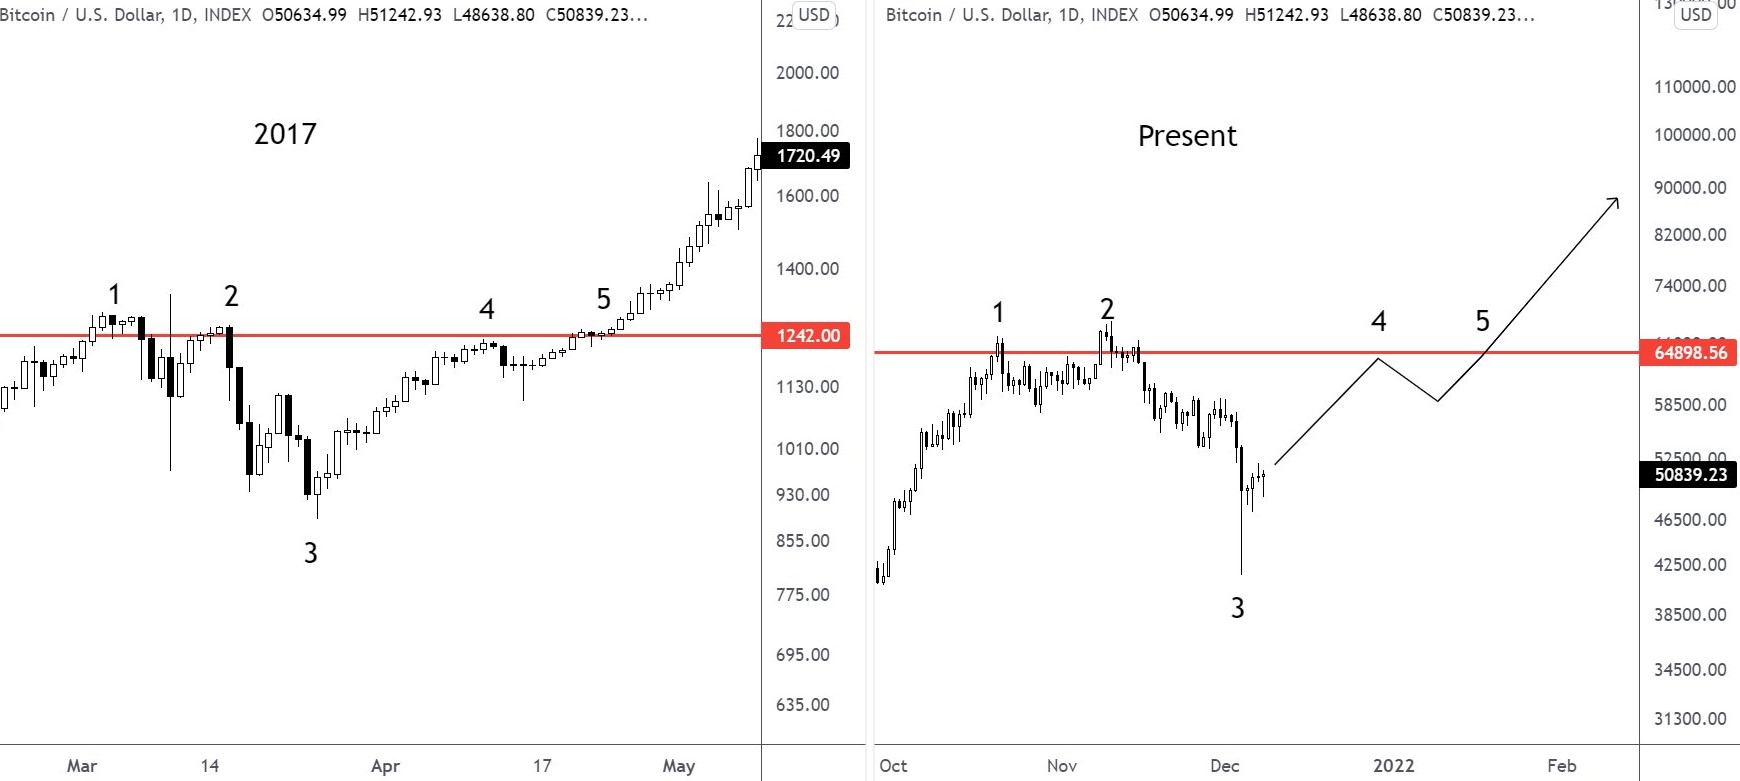
“Price action at a prior ATH that has been most similar to now was in 2017. Maybe?”
While it remains to be seen what happens with Bitcoin price in the near future, it’s looking as if the handful of $100,000 predictions by the end of 2021 will fall short and possibly not occur until sometime in 2022, if at all.
The overall cryptocurrency market cap now stands at $2.25 trillion and Bitcoin’s dominance rate is 40.1%.
The views and opinions expressed here are solely those of the author and do not necessarily reflect the views of Cointelegraph.com. Every investment and trading move involves risk, you should conduct your own research when making a decision.

Leave A Comment