
On Feb. 9, United States Securities and Exchange Commission (SEC) chair Gary Gensler explained why the regulator had cracked down on Kraken cryptocurrency exchange, forcing it to stop its crypto staking program for U.S. clients. This news may have rattled crypto investors and they sold aggressively. Bitcoin (BTC) crashed about 5% on Feb. 9 and several altcoins also followed suit.
The fresh round of selling has traders wondering whether the bear market has resumed or if the dip should be interpreted as a buying opportunity. This question may be troubling to investors, but for now the correction looks to be a normal corrective phase where cryptocurrencies give back some of the gains made in January. However, it would be prudent to wait for the correction to end and a bottom to be confirmed before considering fresh purchases.

What are the important support levels to watch out for Bitcoin and altcoins in the near term? Let’s study the charts of the top-10 cryptocurrencies to find out.
BTC/USDT
The $22,800 support cracked on Feb. 9 and Bitcoin plunged to the strong support near $21,480. A lack of a strong bounce off this level suggests that the correction may deepen further.

The moving averages have completed a golden cross but the bulls need to flip the 200-day simple moving average ($19,722) into support if they want to remain in the game.
A strong rebound off the zone between $21,480 and the 200-day SMA will suggest that bulls are trying to form a higher low. The pair could then gradually move back toward $24,255. The bulls will have to surmount the $25,211 resistance to suggest that the downtrend is over.
ETH/USDT
The bears did not allow Ether (ETH) to sustain above the $1,680 level which may have tempted short-term bulls to book profits.

Instead, if the price turns up from the moving averages, it will indicate that bulls are trying to flip the 200-day SMA ($1,442) into support. The bulls will then make another attempt to thrust the price above $1,680 and gain control. The ETH/USDT pair could then start its northward march toward $2,000.
BNB/USDT
BNB (BNB) nose-dived back below the breakout level of $318 on Feb. 9, which shows aggressive selling at higher levels. This clears the path for a possible dump to the 200-day SMA ($287).

On the other hand, if the price breaks below the moving averages, the selling could intensify and the pair may tumble to $240.
XRP/USDT
After staying above the 200-day SMA ($0.39) for several days, XRP (XRP) plummeted below the support on Feb. 9. This suggests that bears are trying to take charge.
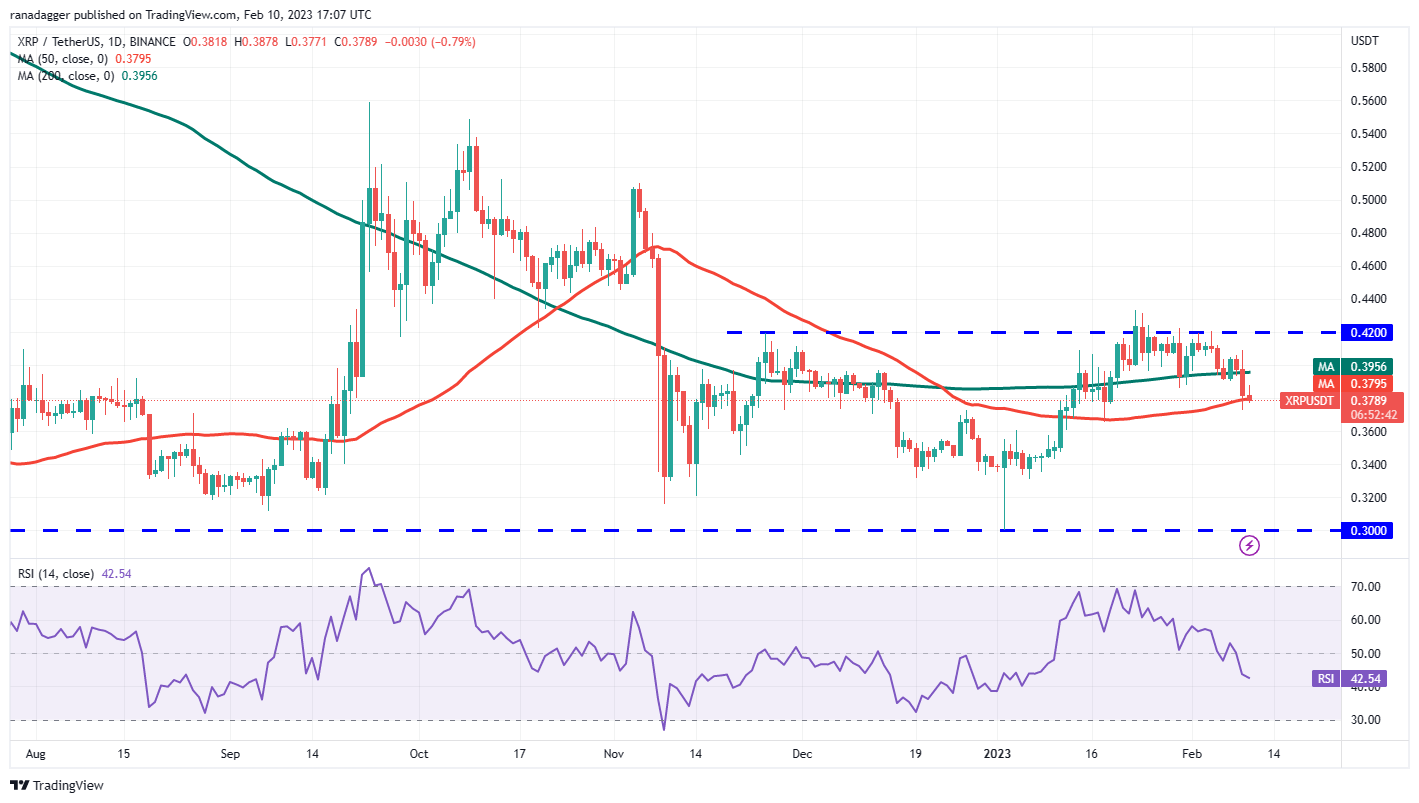
Conversely, if the 50-day SMA gives way, it will signal that bears are back in the driver’s seat. The XRP/USDT pair could then drop to $0.33.
ADA/USDT
The 200-day SMA ($0.39) acted as a strong obstacle for Cardano (ADA). Though the bulls pushed the price above the resistance on several occasions, they failed to build upon the strength.

On the upside, buyers will have to overcome the zone between the 200-day SMA and $0.42 to hint at a potential trend change. That could increase the possibility of a rally above $0.44.
DOGE/USDT
Dogecoin (DOGE) plunged below the $0.09 support on Feb. 9 and reached the 50-day SMA ($0.08). This dip has pulled the RSI into the negative territory, indicating that the momentum has shifted in favor of the bears.

If the price rebounds off the current level with strength, it will indicate that the bulls are striving to flip the 200-day SMA ($0.08) into support. If they do that, the pair could start its journey back toward $0.10.
MATIC/USDT
Buyers pushed Polygon (MATIC) above the $1.30 overhead resistance on Feb. 8 and 9 but could not sustain the breakout. This shows that bears sold the rise above $1.30.

Contrarily, if the price once again turns down from the overhead resistance, it will suggest that bears continue to fiercely guard the $1.30 level. The bears will have to sink the price below $1.16 to make way for a retest of $1.05.
Related: Ethereum price risks 20% correction amid SEC’s crackdown on crypto staking
LTC/USDT
Litecoin (LTC) turned down from $102.50 on Feb. 8. This shows that the failure to break above the resistance may have tempted short-term traders to book profits.
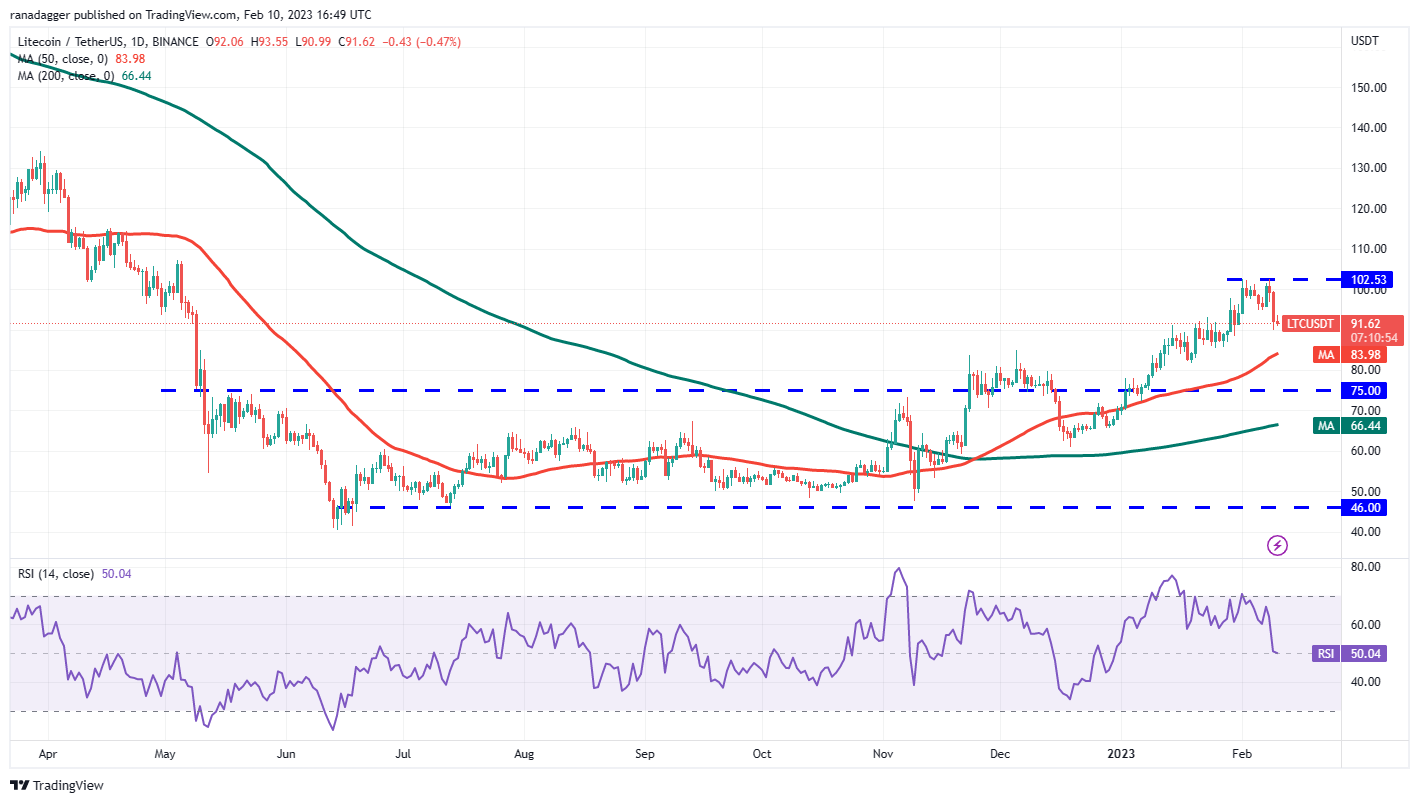
If bulls want to resume the uptrend, they will have to quickly push the price back above $98. That will signal a positive sentiment, indicating that traders are buying on dips. The bulls will then again attempt to overcome the barrier at $102.50 and start the next leg of the uptrend toward $115.
DOT/USDT
The failure of the bulls to propel Polkadot (DOT) above $7.25 may have attracted selling by short-term traders and that has pulled the price to the 200-day SMA ($6.33).

On the contrary, if the price plummets below the 50-day SMA ($5.59), it will suggest that bears are back in control.
AVAX/USDT
Avalanche (AVAX) turned down from the overhead resistance at $22 and reached the 200-day SMA ($17.88). Buyers are expected to defend the zone between the moving averages.

Another possibility is that the price rebounds off the moving averages but fails to climb above $22. That could result in a consolidation for a few days. The bears will have to sink the price below the 50-day SMA to gain the upper hand.
The views, thoughts and opinions expressed here are the authors’ alone and do not necessarily reflect or represent the views and opinions of Cointelegraph.
This article does not contain investment advice or recommendations. Every investment and trading move involves risk, and readers should conduct their own research when making a decision.

Related Posts
 S&P 500 Snapshot: Down For The Day And For The Third Consecutive Week
 EUR/USD: Busted Bearish Head-And-Shoulders Becomes Bullish Head-And-Shoulders?
 Rising Oil Pressure
- Uncertainty Reigns Supreme Over Dollar Outlook
- USDJPY Builds Up On Bullish Offensive
- Royal House of Savoy NFTs to debut on the 150th anniversary of the Unification of Italy
Leave A Comment