
Bitcoin (BTC) and most major altcoins remain under pressure as supports give way and bears sell at each rally attempt. This negative sentiment pulled the Crypto Fear & Greed Index to 10/100 on Jan. 8, one of its lowest readings ever. In comparison, 2021 had started on a bullish note with the reading hitting levels of 93/100, indicating “extreme greed.”
This weak opening in the new year has not unnerved Bloomberg Intelligence analyst Mike McGlone who remains bullish. He said in a recent analysis that Bitcoin may rally to $100,000 and Ether (ETH) to $5,000 this year.
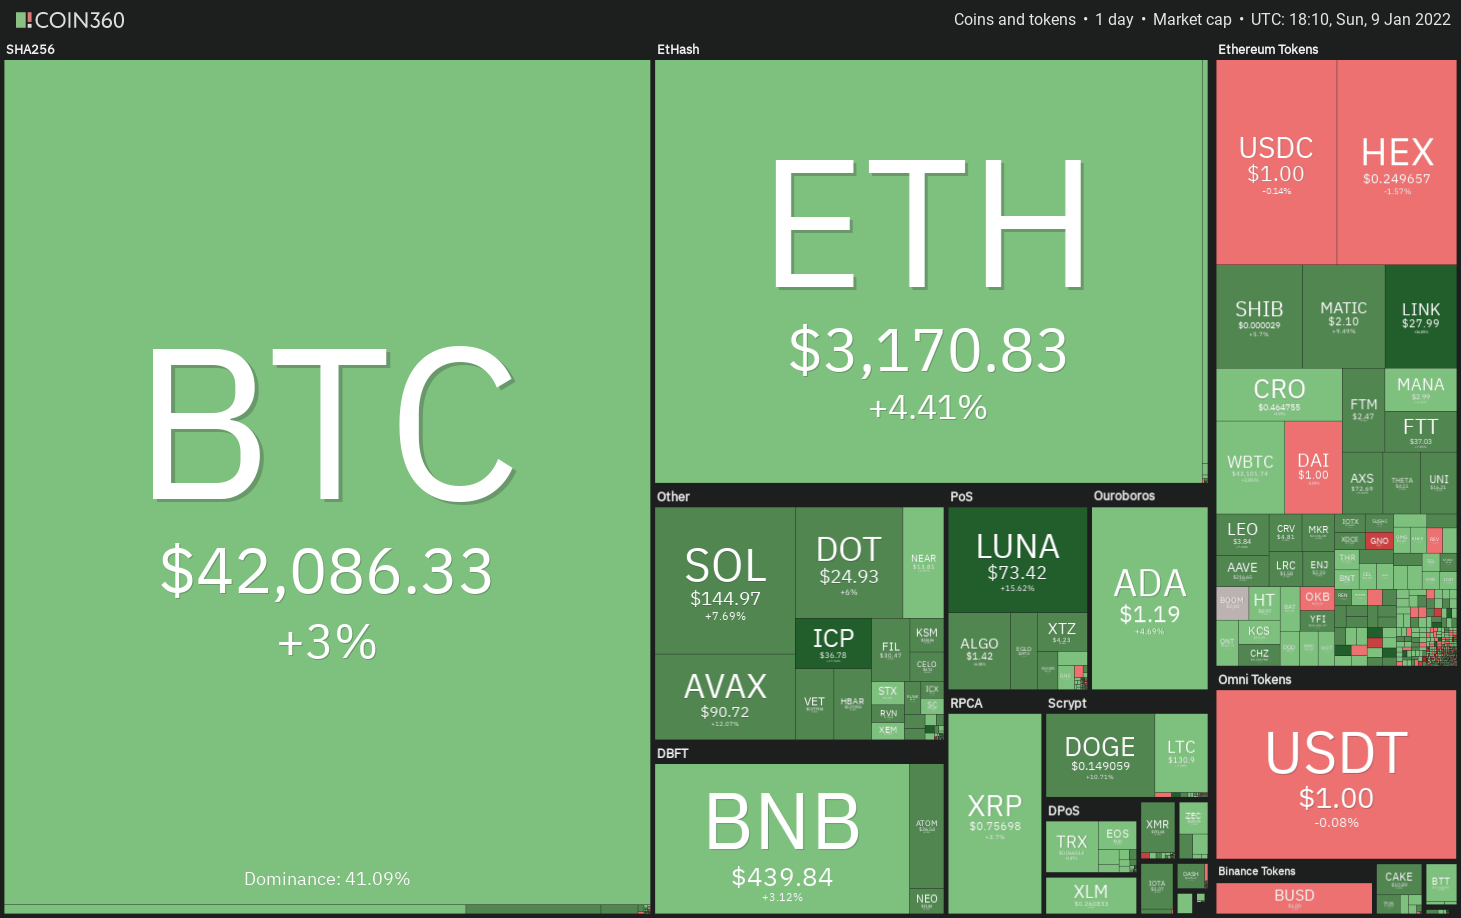
Could Bitcoin bounce off the strong support, attracting buying in select altcoins? Let’s study the charts of the top-5 cryptocurrencies that may remain positive in the short term.
BTC/USDT
Bitcoin’s downtrend has reached the strong support at $39,600. The price formed a Doji candlestick pattern on Jan. 8, indicating indecision among the bulls and the bears.
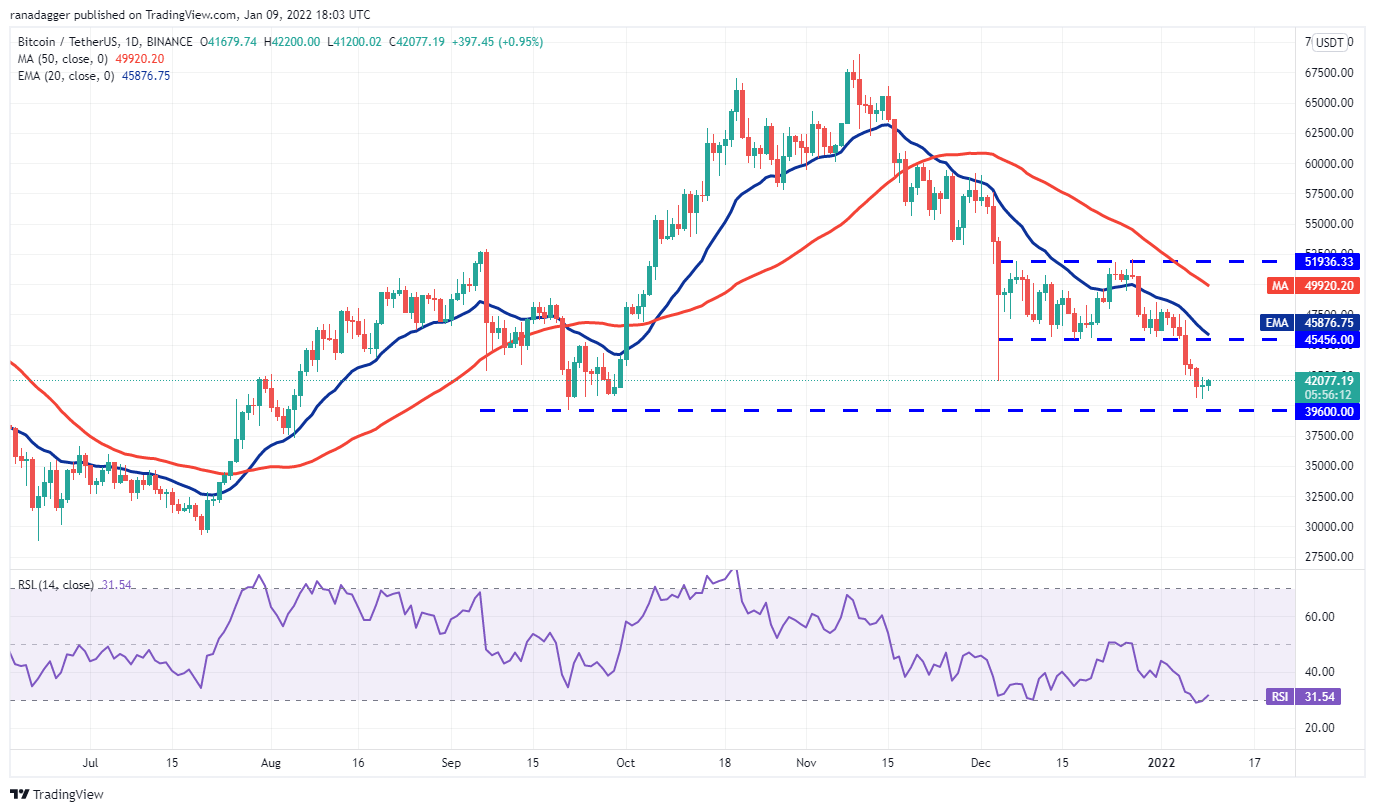
On the other hand, if the price rises from the current level, the pair could rise to the 20-day exponential moving average ($45,876). If the price turns down from this level, it will suggest that the sentiment remains negative and traders are selling on rallies. That will increase the likelihood of a break below $39,600 I .
The bulls will have to push and sustain the price above the moving averages to indicate a possible change in trend.
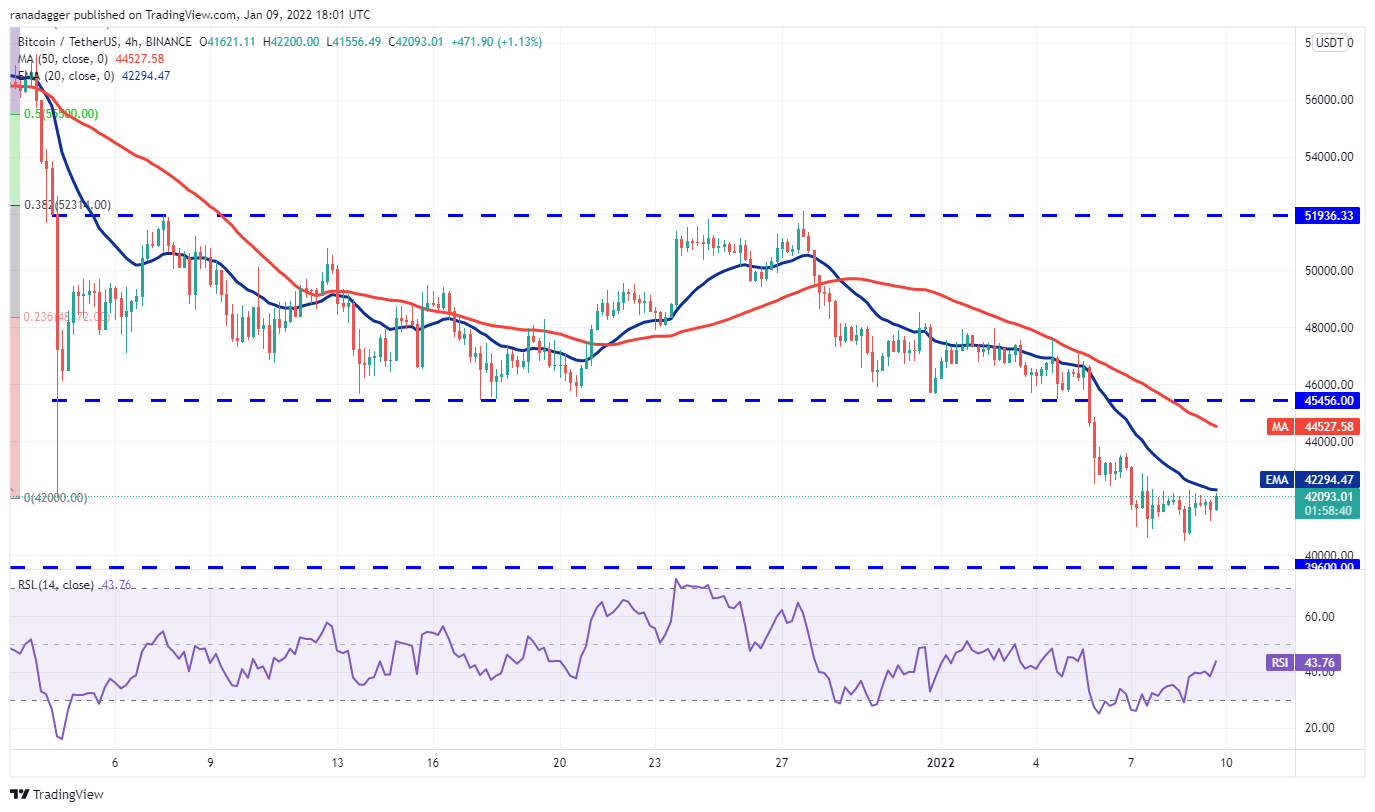
If the price turns down from the 20-EMA, the bears will attempt to sink the pair below $39,600 and extend the downtrend.
Alternatively, a break and close above the 20-EMA could push the pair to the 50-simple moving average. If bulls push the price above this resistance, it will suggest that bears may be losing their grip.
LINK/USDT
Chainlink (LINK) has been trading in a large range between $15 and $35.33 for the past few months. The bulls have pushed the price above the moving averages and the RSI has risen close to the overbought zone, indicating that buyers have the upper hand in the short term.
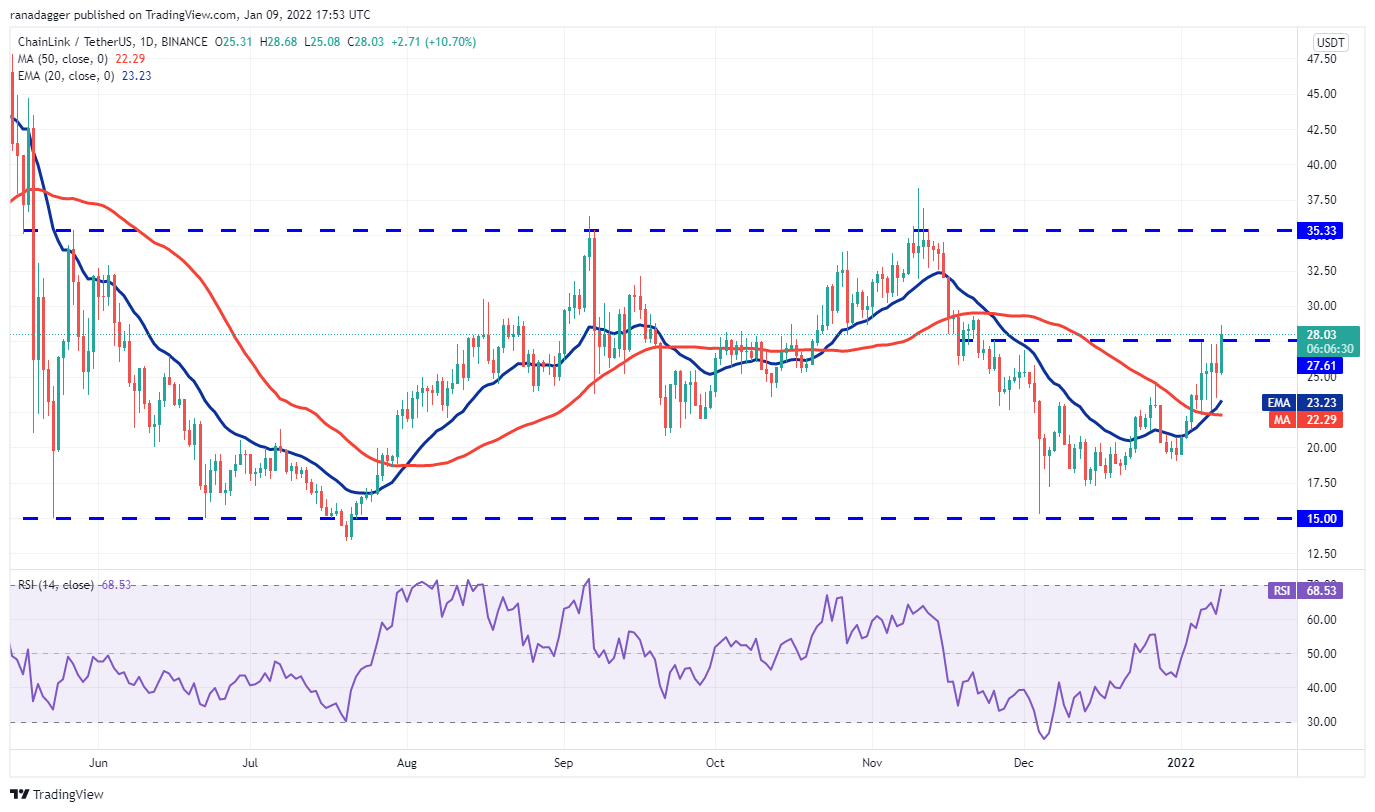
If bulls maintain the price above $27.61, the LINK/USDT pair could rise to 30 and thereafter to the overhead resistance at $35.33. This bullish view will invalidate if the price turns down from the current level and breaks below the moving averages. The pair could then drop to $18.
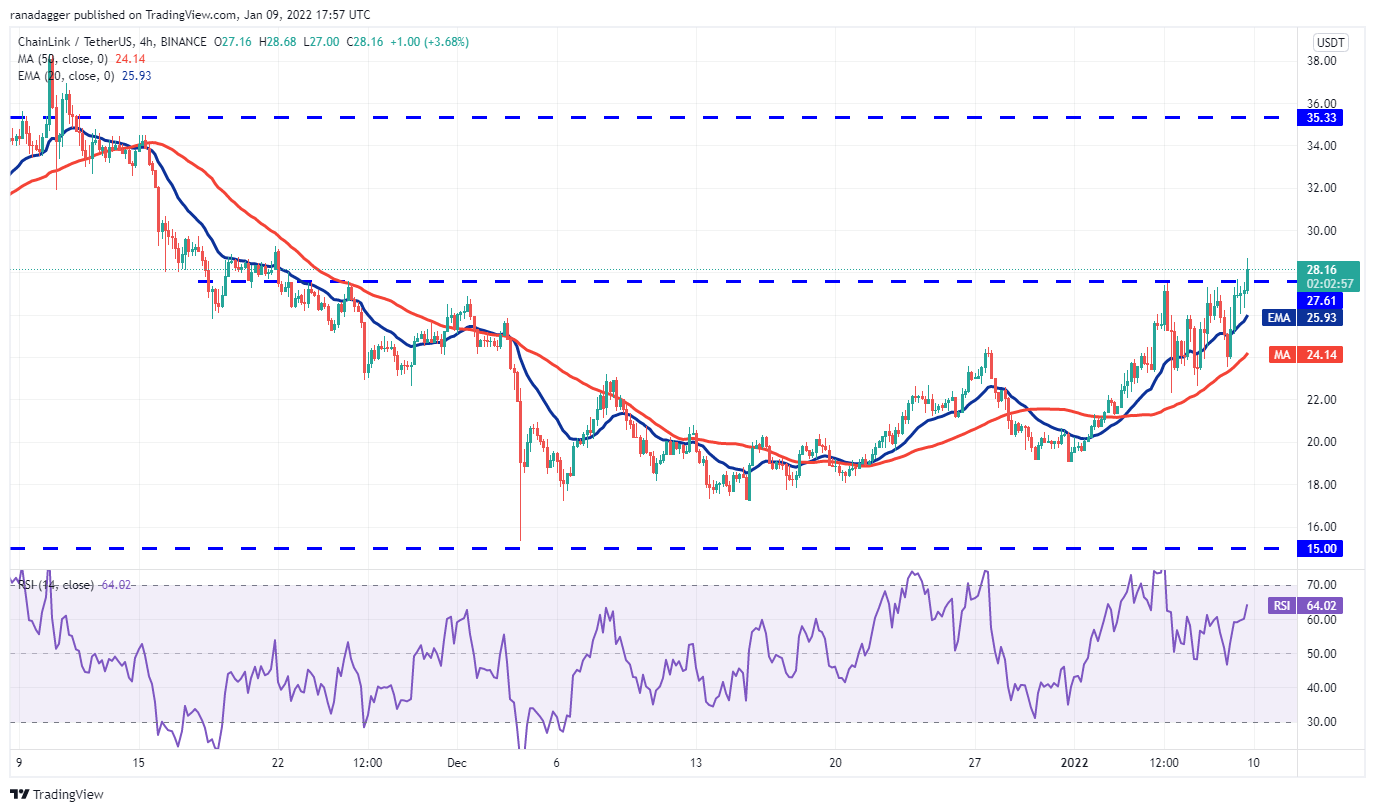
On the contrary, if the price turns down from the current level, it will suggest that the break above $27.61 may have been a bull trap. The bears will then try to pull the price below the 50-SMA. If they do that, the next stop could be $22.
ICP/USDT
Internet Computer (ICP) broke and closed above the downtrend line on Jan. 4 which was the first indication that the downtrend could be ending. The bears tried to trap the aggressive bulls and pull the price back below the 20-day EMA ($29) but failed.
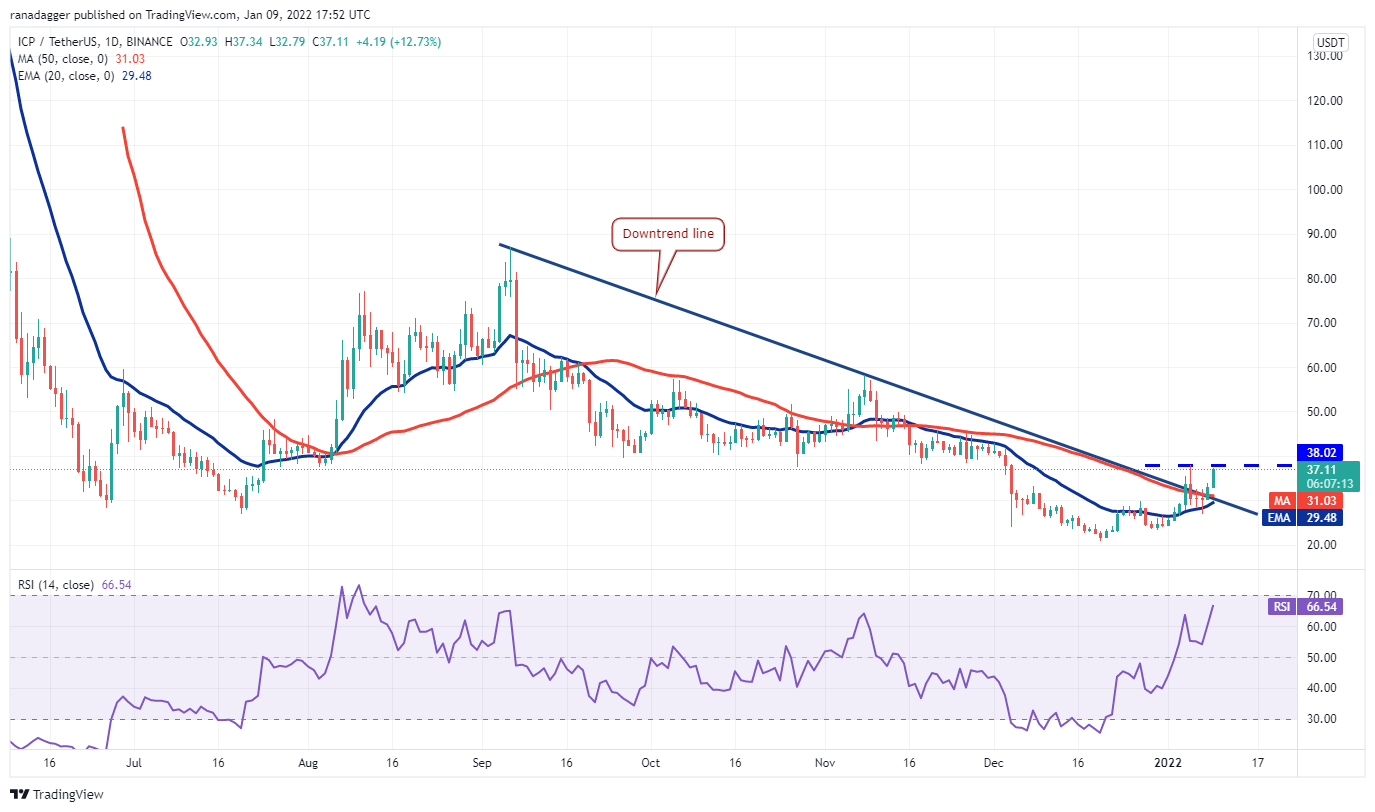
If buyers push and sustain the price above $38.02, the ICP/USDT pair could rally to $45.79. This level may again act as a stiff hurdle but if crossed, the up-move may reach $58.30.
Contrary to this assumption, if the price turns down from the current level and breaks below the 20-day EMA, it will indicate that the breakout above the downtrend line may have been a bull trap.

If bulls push and sustain the price above $38.02, the pair could extend its up-move. On the contrary, if the price turns down from the overhead resistance, the bears will attempt to pull the pair below $33.29. If they manage to do that, the pair could drop to the 50-SMA.
Related: Even after the pullback, this crypto trading algo’s $100 bag is now worth $20,673
LEO/USD
UNUS SED LEO (LEO) has been trading in a gradual uptrend for the past several weeks where the 50-day SMA ($3.55) has been acting as a strong support.
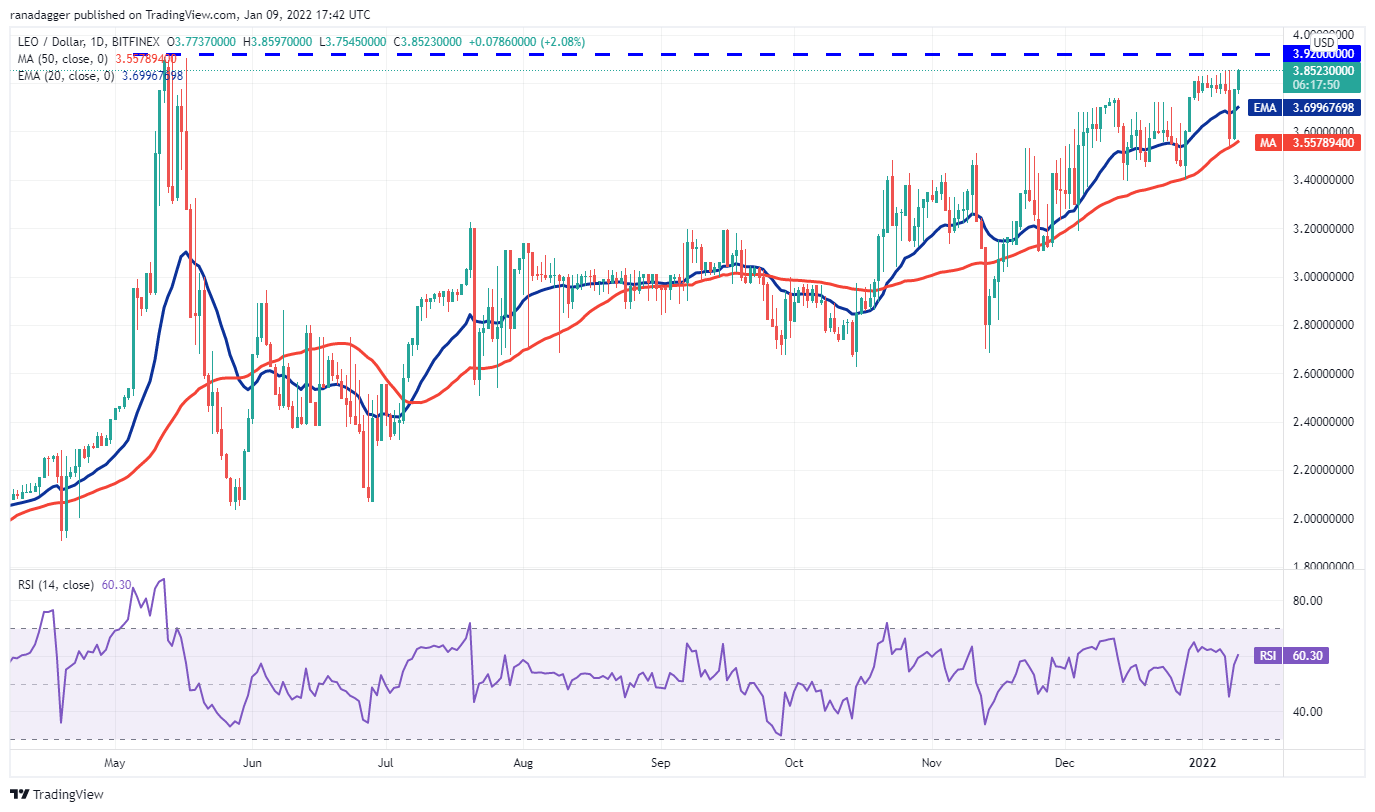
The bulls will now attempt to drive the price above the all-time high at $3.92. If they succeed, the pair may resume its uptrend and reach $4.25. This positive view will invalidate if the price turns down and plummets below the 50-day SMA. That could start a correction to $3.40.

The bulls are again attempting to push and sustain the price above $3.85. If they manage to do that, the pair could start its journey toward the resistance line of the channel. The bears will have to sink and sustain the price below the channel to invalidate the bullish view.
ONE/USDT
Harmony (ONE) has been trading between the 20-day EMA ($0.27) and $0.33 for the past few days. This suggests that bulls are buying on dips and bears are selling on rallies.
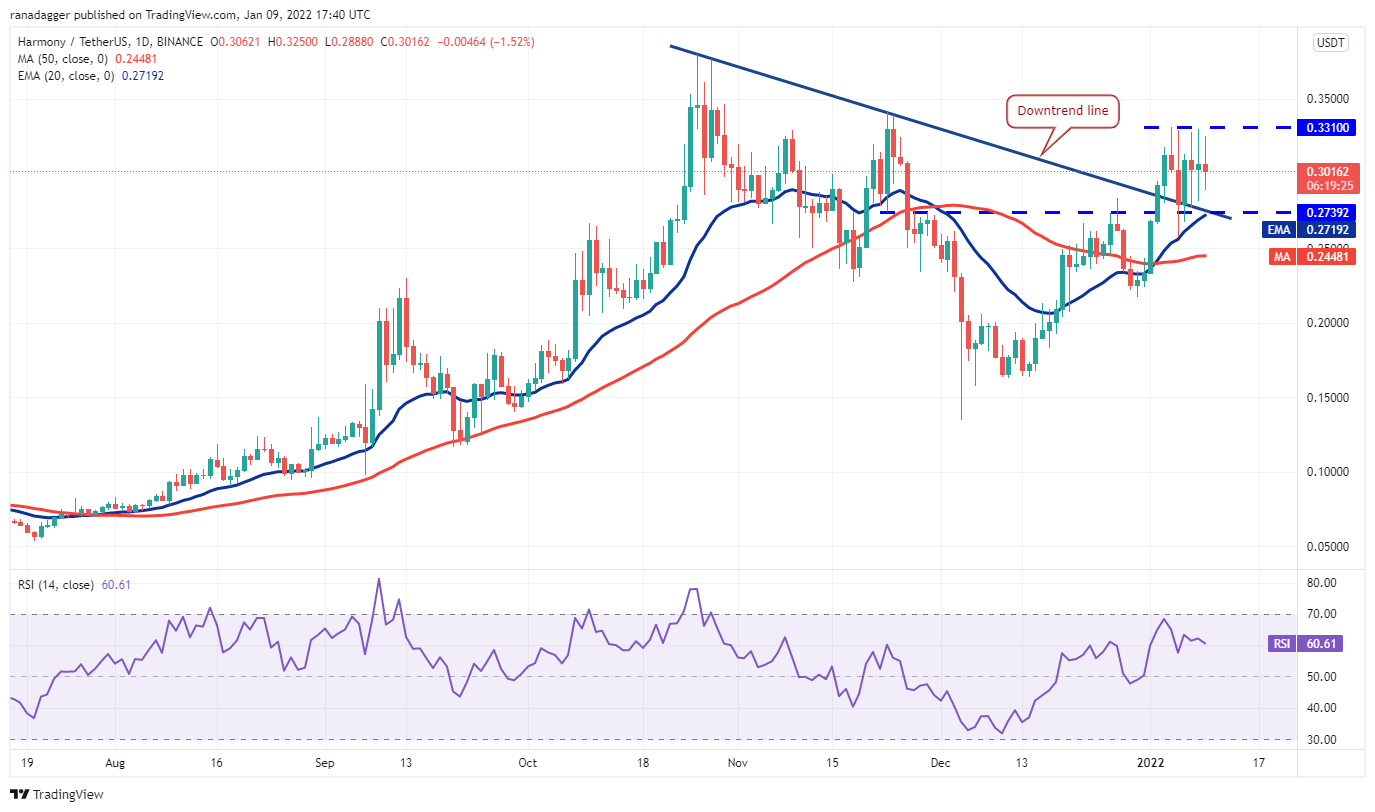
Contrary to the assumption, if the price breaks below the 20-day EMA, it will suggest that bears have overpowered the bulls. That could pull the pair down to the 50-day SMA ($0.24) and later to $0.21.
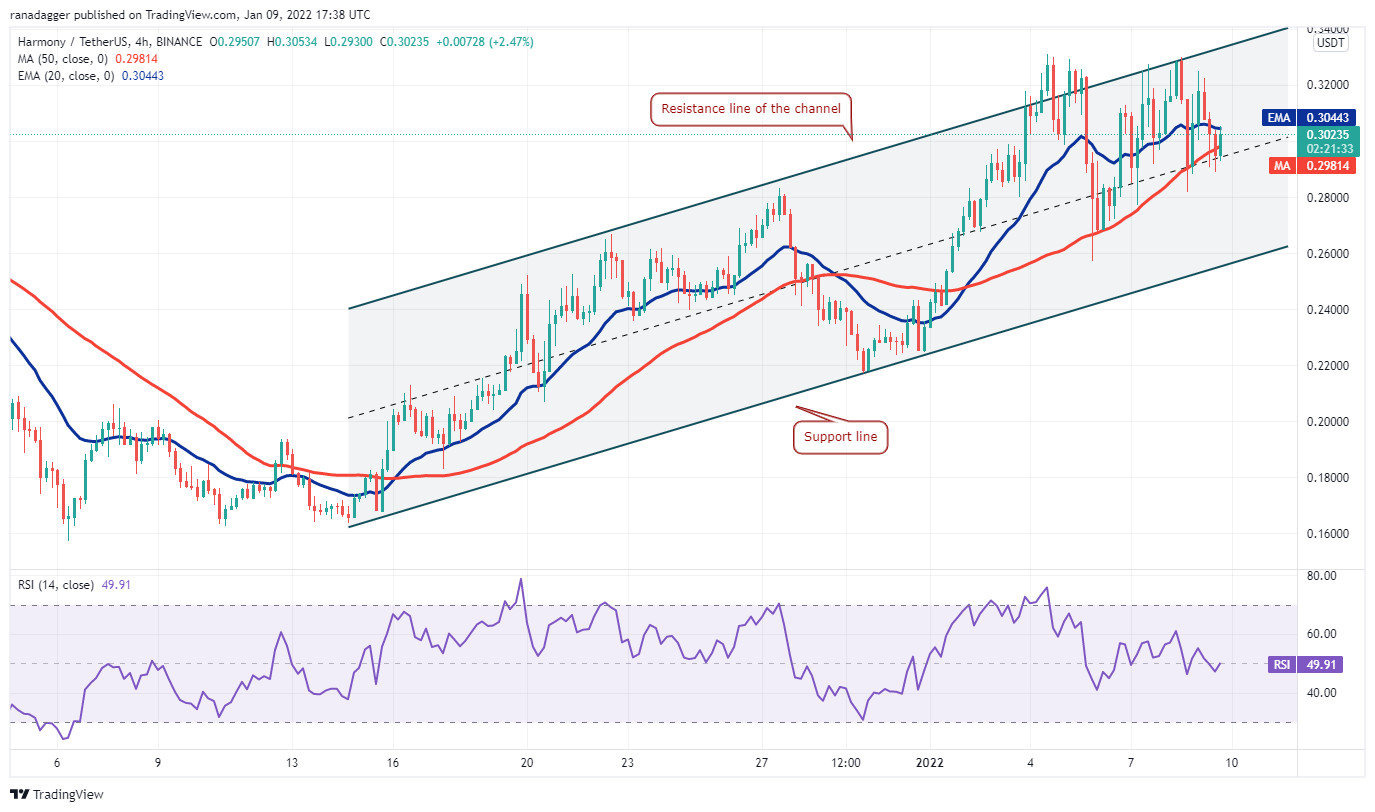
The price dipped back into the channel but a minor positive is that it bounced off the 50-SMA. This indicates that sentiment remains positive and bulls are buying on dips.
If the price rises above the 20-EMA, the pair could again rally to the resistance line of the channel. A break and close above this level could signal a pick up in momentum. Conversely, a break and close below the 50-SMA could pull the pair down to the support line of the channel.
The views and opinions expressed here are solely those of the author and do not necessarily reflect the views of Cointelegraph. Every investment and trading move involves risk, you should conduct your own research when making a decision.

Leave A Comment