
The sentiment in the crypto markets can change quickly as seen from the Crypto Fear and Greed Index, which has risen from levels of extreme fear on Sept. 30 to neutral today. The sentiment may improve further if Bitcoin (BTC) breaks out and sustains above the psychologically critical level at $50,000.
One important event that may boost short-term sentiment is the U.S. Securities and Exchange Commission’s (SEC) decision on Bitcoin exchange-traded fund (ETF) applications. Although the SEC extended the deadline of four Bitcoin ETF applications by 45 days on Oct. 1, Bloomberg’s senior ETF analyst Eric Balchunas is hopeful that a futures-backed Bitcoin ETF may receive the green signal by the middle of October.
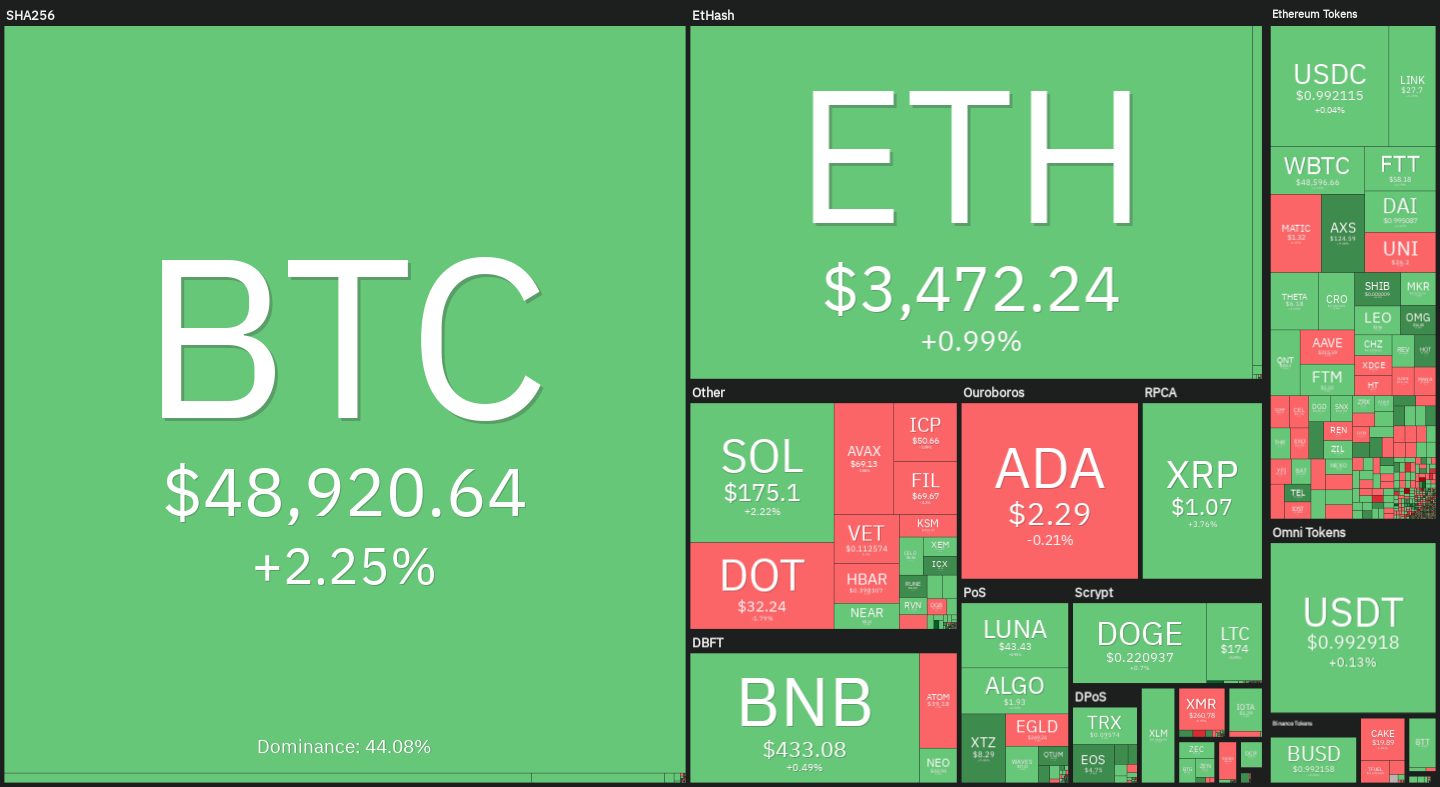
If bulls build on the recent strength in Bitcoin and clear the hurdle at $50,000, several altcoins may pick up momentum. Let’s study the charts of the top-5 cryptocurrencies that may outperform in the short term.
BTC/USDT
Bitcoin broke above the 50-day simple moving average ($46,633) on Oct. 1 but the bears are attempting to stall the recovery near the resistance at $48,843.20. However, a positive sign is that bulls have not allowed the price to dip below the 50-day SMA.
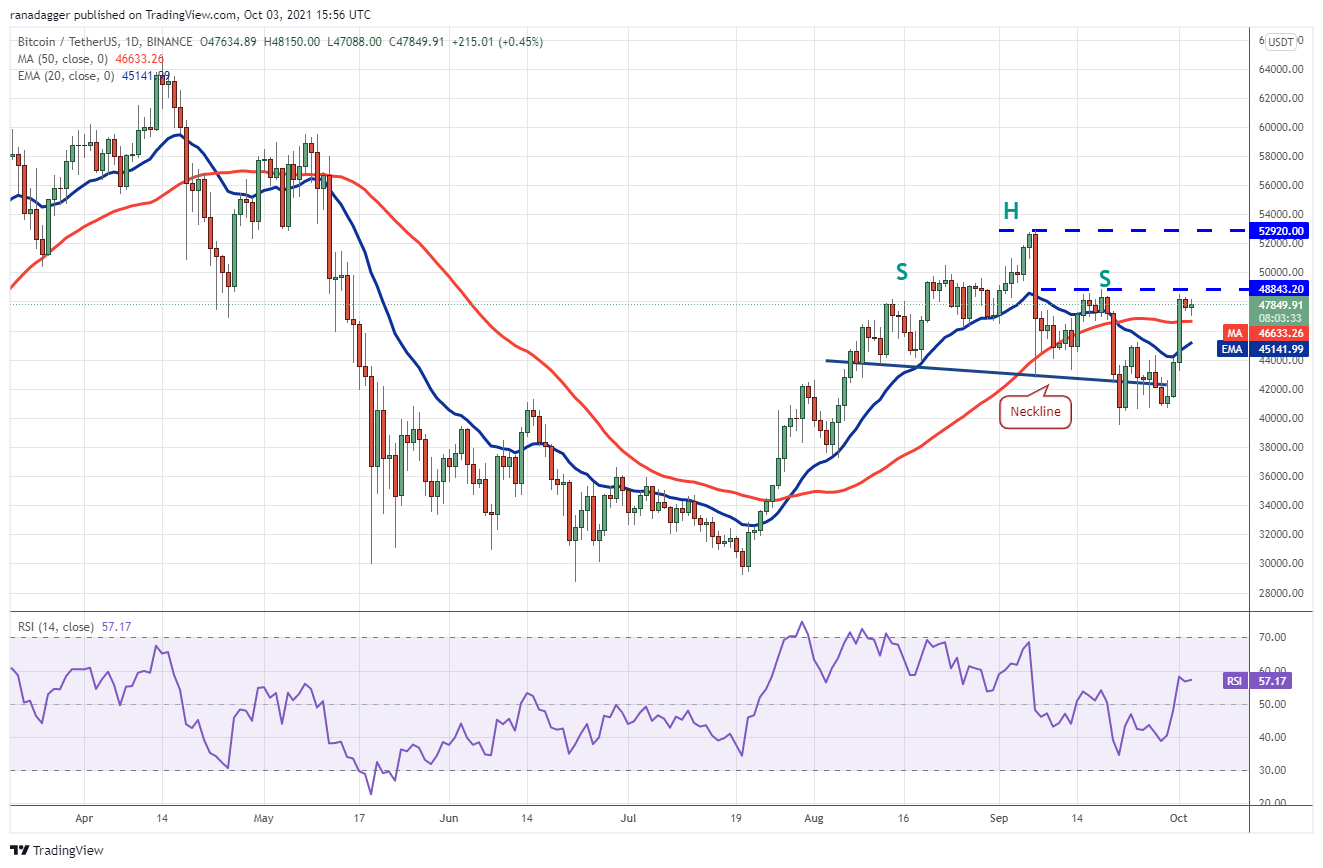
This level may again act as stiff resistance but if bulls bulldoze their way through, the head and shoulders pattern will be invalidated. That could result in a pick-up in momentum and the pair could rise to $60,000.
Contrary to this assumption, if the price turns down from the current level and breaks below the moving averages, it will suggest that higher levels are attracting aggressive selling from the bears. The pair may then drop toward $40,000.
If bulls thrust the price above $48,843, the pair could rise to the psychological mark at $50,000 and then challenge the stiff resistance at $52,920.
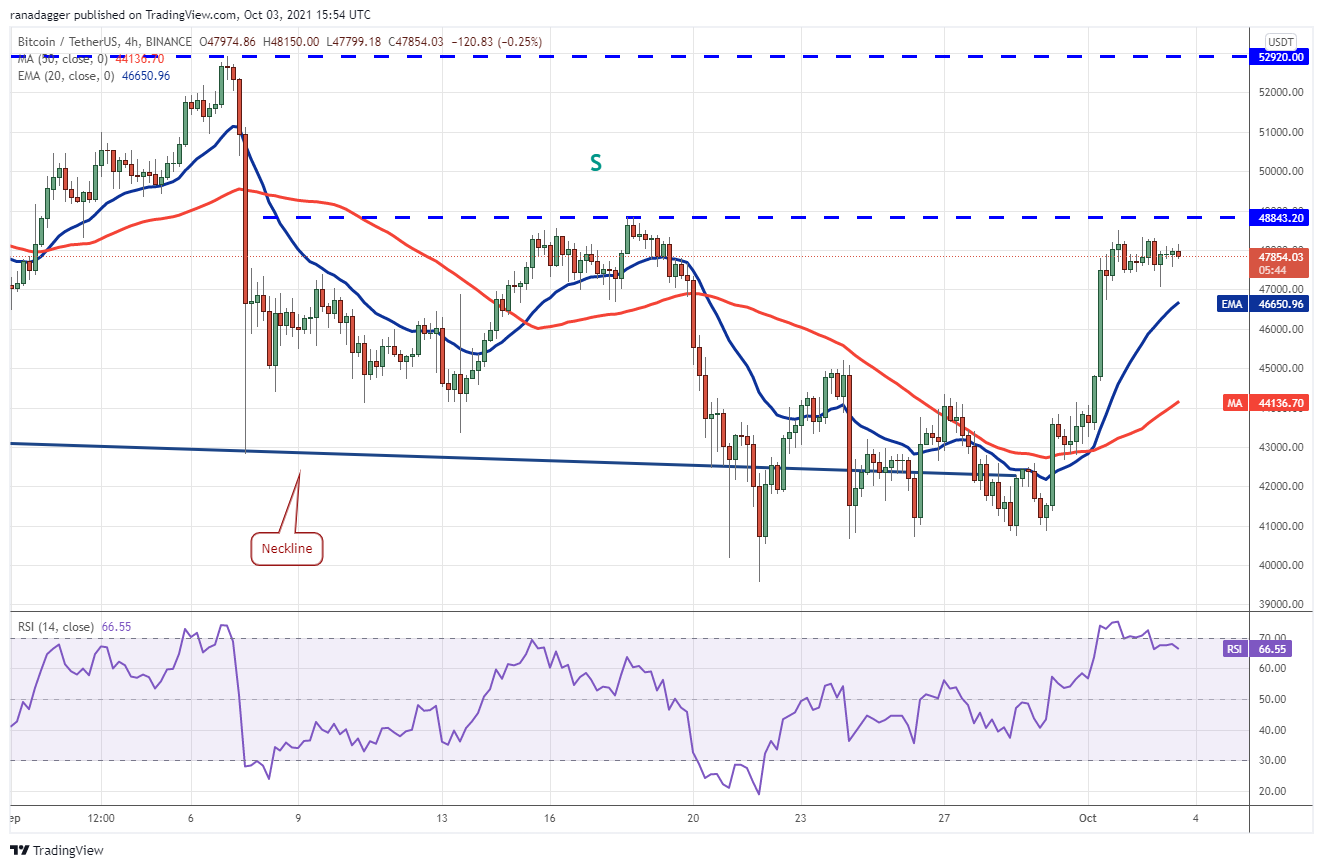
Conversely, if the price turns down and breaks below the 20-EMA, it will suggest that short-term traders are booking profits. The pair could then drop to $45,000 and later to the 50-SMA.
LUNA/USDT
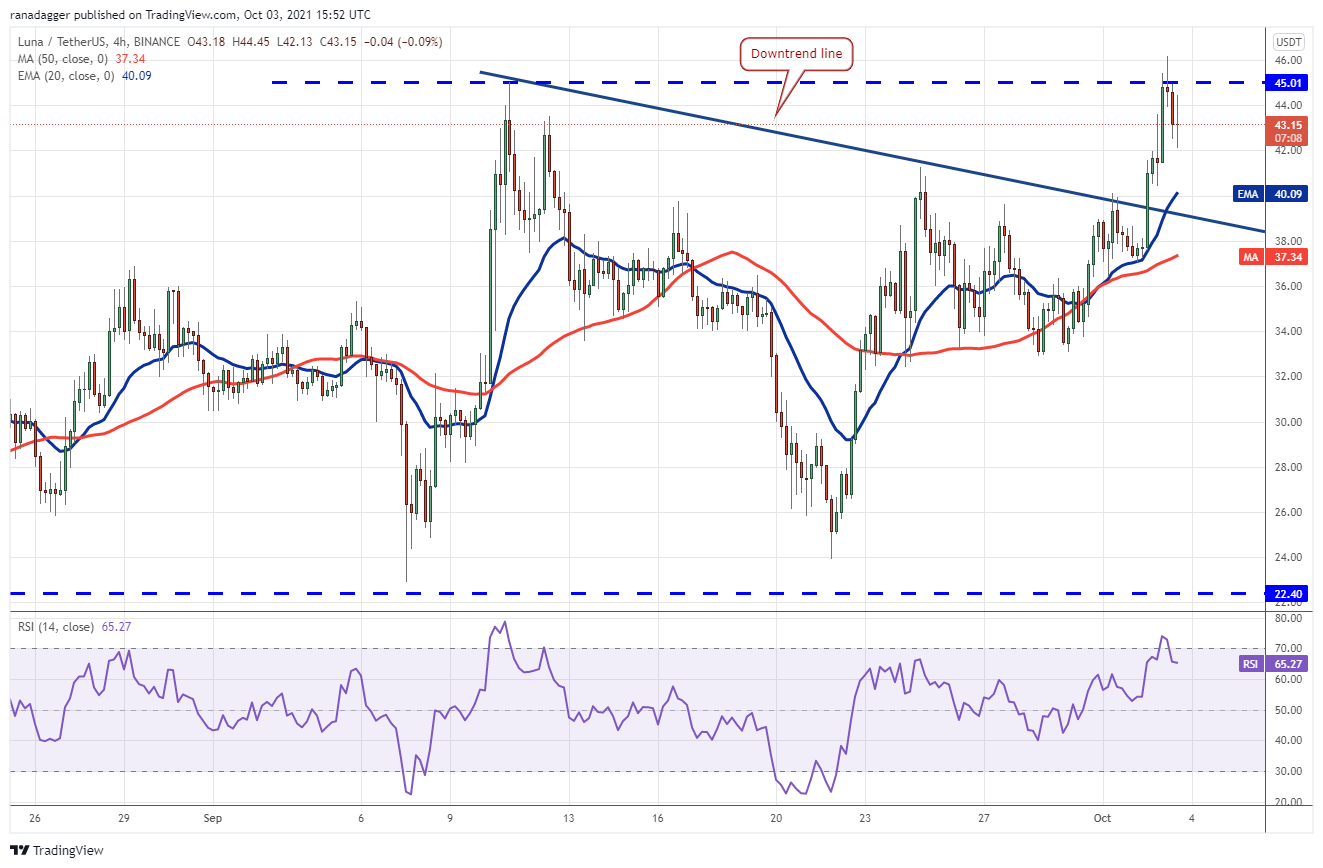
Terra protocol’s LUNA token broke above the downtrend line on Oct. 2 and bulls followed it up with a break above the all-time high at $45.01 today. However, the long wick on today’s candlestick suggests that bears are attempting to defend the $45.01 level aggressively.
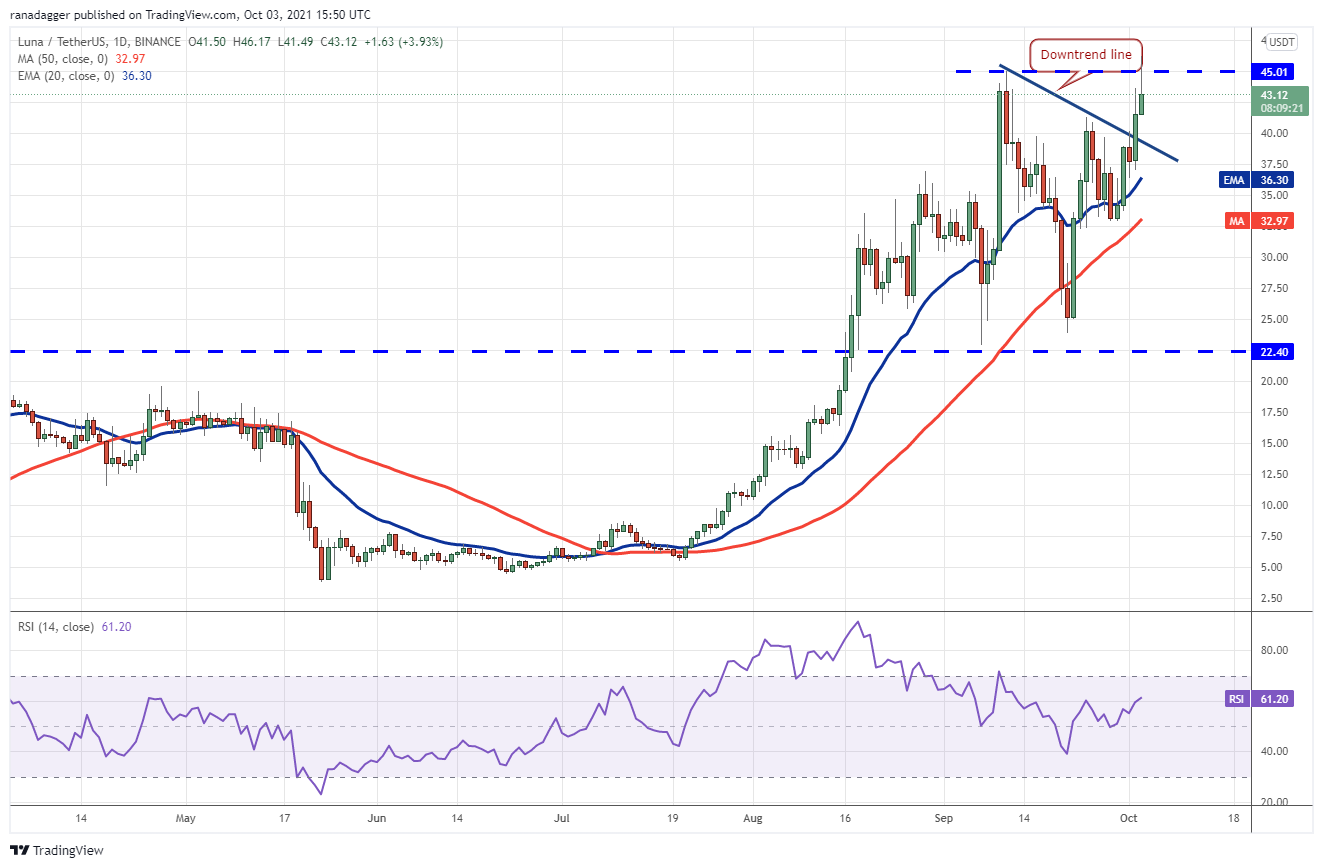
The bulls will then make one more attempt to push the price above the $45.01 to $46.17 resistance zone and start the next leg of the uptrend. The psychological level at $50 may act as a resistance but if it is crossed, the LUNA/USDT pair may rally to $65.
On the contrary, if the price turns down and breaks below the 20-day EMA ($36.30), the next stop could be the 50-day SMA ($32.97). A break below this support will suggest that the bulls are losing their grip.
The first support on the downside is the 20-EMA. A strong bounce off this support will suggest the sentiment remains positive. The bulls then try to propel the price above $46.17.
Alternatively, a break below the 20-EMA could pull the price down to the 50-SMA. If this support cracks, the pullback may deepen to $33.
ATOM/USDT
Cosmos (ATOM) successfully held the breakout level at $32.32 on Sep. 29, which suggests that sentiment remains positive and bulls are buying on dips.
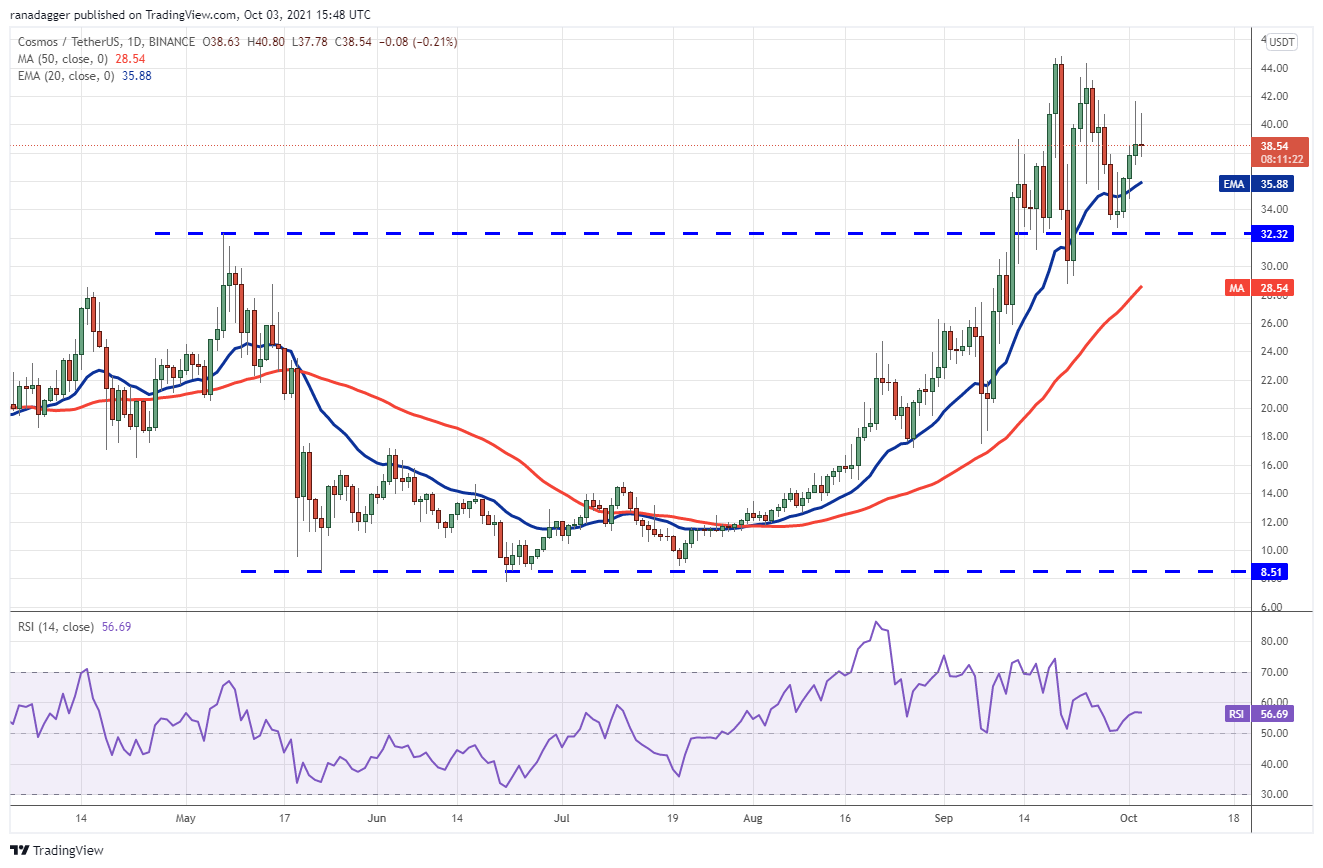
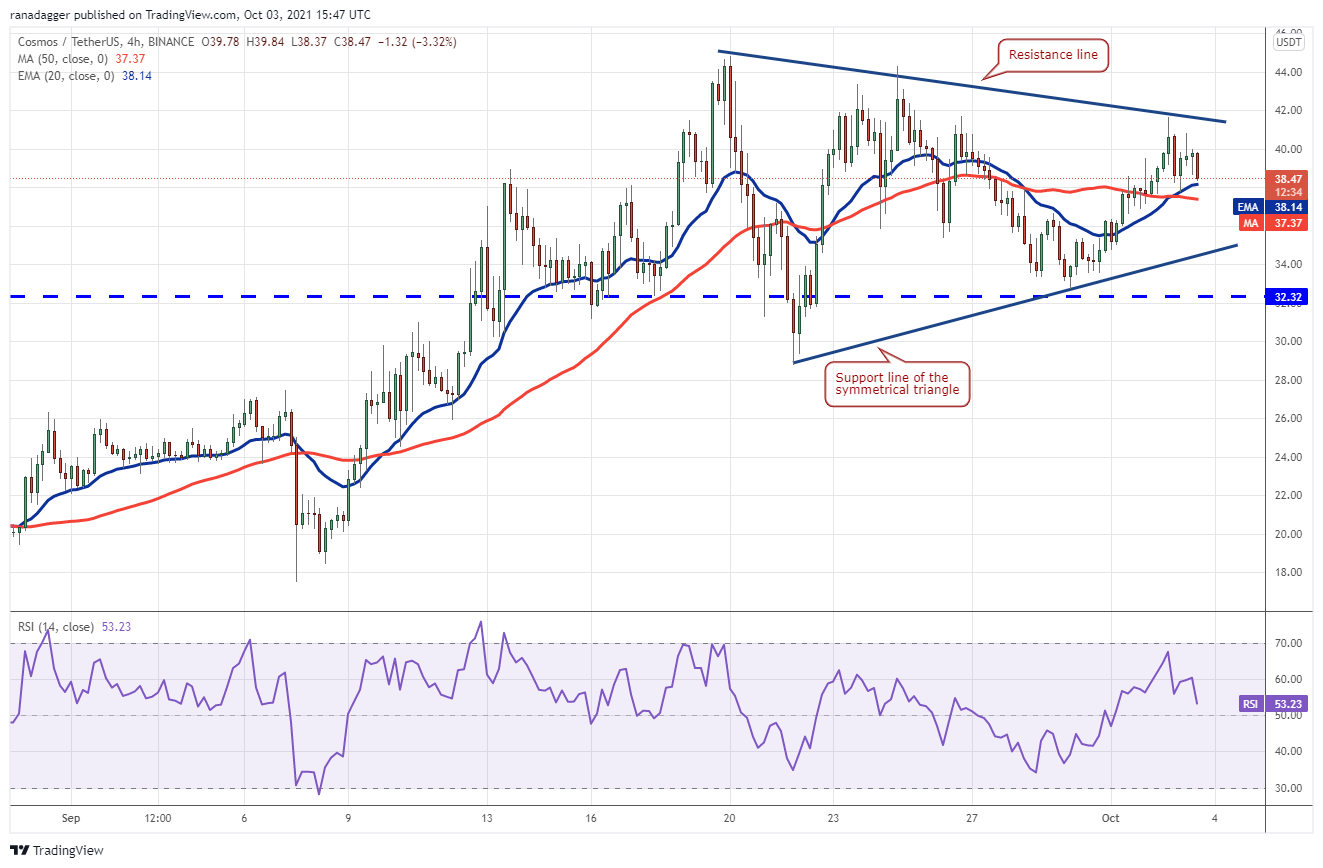
The long wick on today’s candlestick suggests selling at higher levels. If the price turns down from the current level and breaks below the 20-day EMA, the bears will make one more attempt to sink the price below $32.32. If they succeed, the ATOM/USDT pair could drop to the 50-day SMA ($28.54).
If they succeed, the pair could rally to $44.80 and then to the psychological level at $50. A break and close above this level could open the doors for an up-move toward the pattern target at $57.61.
On the contrary, if the price slips below the moving averages, the next stop could be the support line. If this level cracks, the pair could drop to $28.83 and then to $24.50.
Related: Ethereum fractal from 2017 that resulted in 7,000% gains for ETH appears again in 2021
XTZ/USDT
Tezos (XTZ) rebounded off the 50-day SMA ($5.50) on Sept. 29 and the momentum picked up after the bulls pushed the price above the 20-day EMA ($6.40) on Sept. 30.
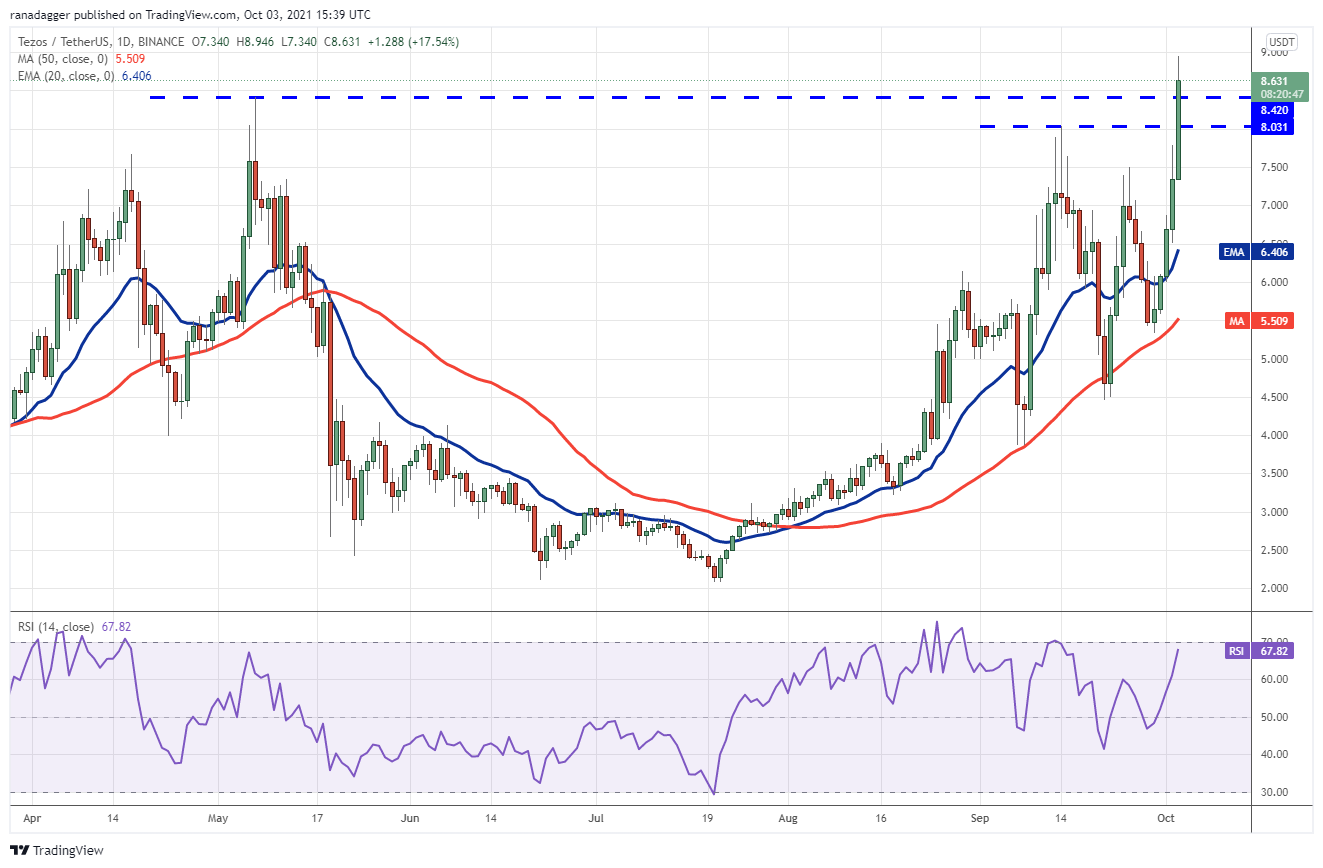
If bulls sustain the price above $8.42, it will suggest the start of a new uptrend. Contrary to this assumption, if bears pull and sustain the price below $8.03, it will suggest profit-booking at higher levels. The XTZ/USDT pair could then drop to the 20-day EMA.
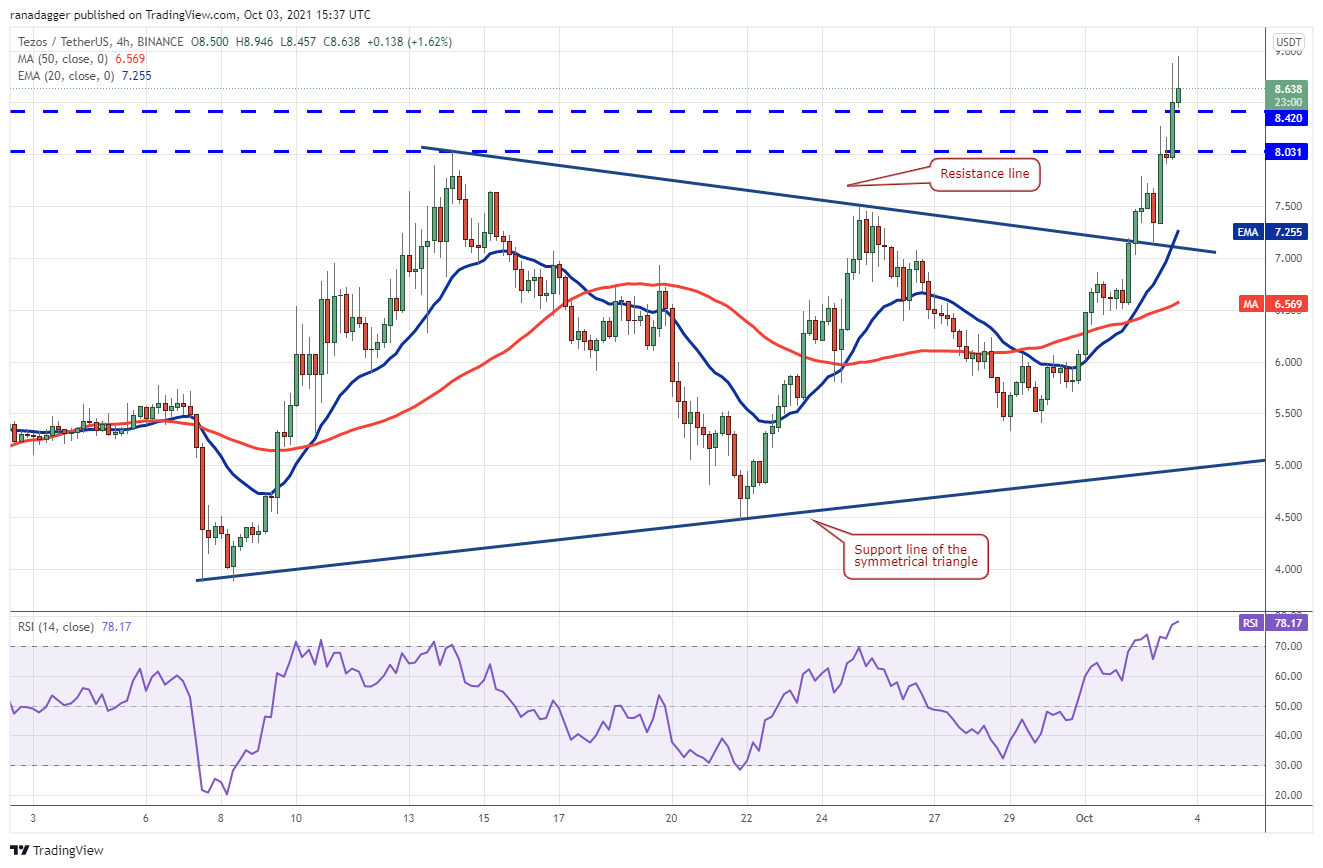
This setup has a pattern target at $11.33. The rising 20-EMA and the RSI in the overbought zone suggest that bulls have an edge.
The first sign of weakness will be a close below $8.03. That could open the doors for a retest of the 20-EMA. A strong rebound off this level will suggest that the sentiment remains positive and traders are buying on dips. Conversely, a break below the 20-EMA could pull the price down to $7 and later to $6.50.
AXS/USDT
Axie Infinity (AXS) soared above the previous all-time high at $94.67 on Oct. 1, which suggests the resumption of the uptrend. A coin hitting a new all-time high is a positive sign as it shows strong demand from traders.
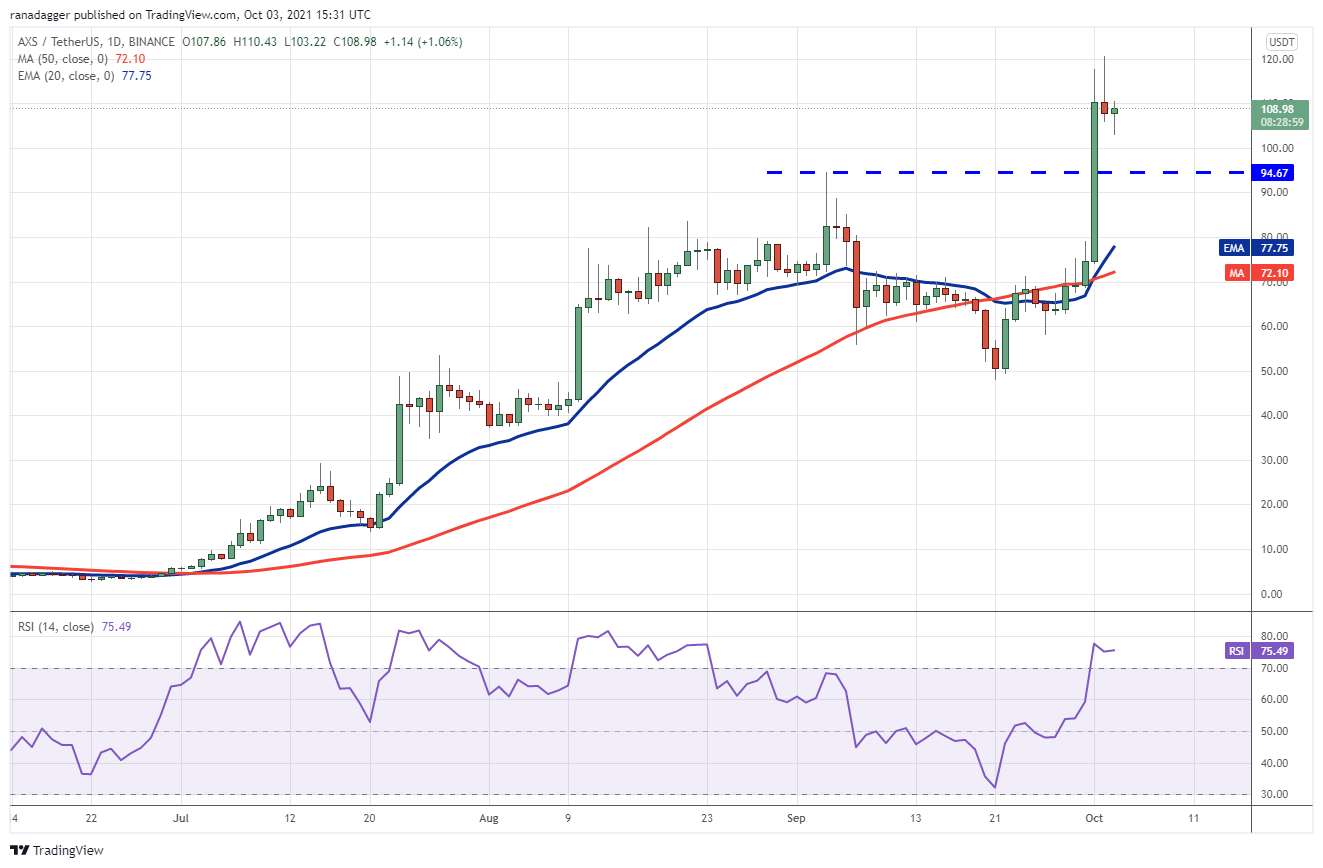
The 20-day EMA ($77) has started to turn up and the RSI is in the overbought zone, indicating that bulls have the upper hand. If buyers drive the price above $120.57, the pair could start its northward march toward $150 and then $165.58.
Contrary to this assumption, if bears pull the price below the breakout level at $94.67, it may result in aggressive profit-booking by traders and the pair may then drop to the 20-day EMA.
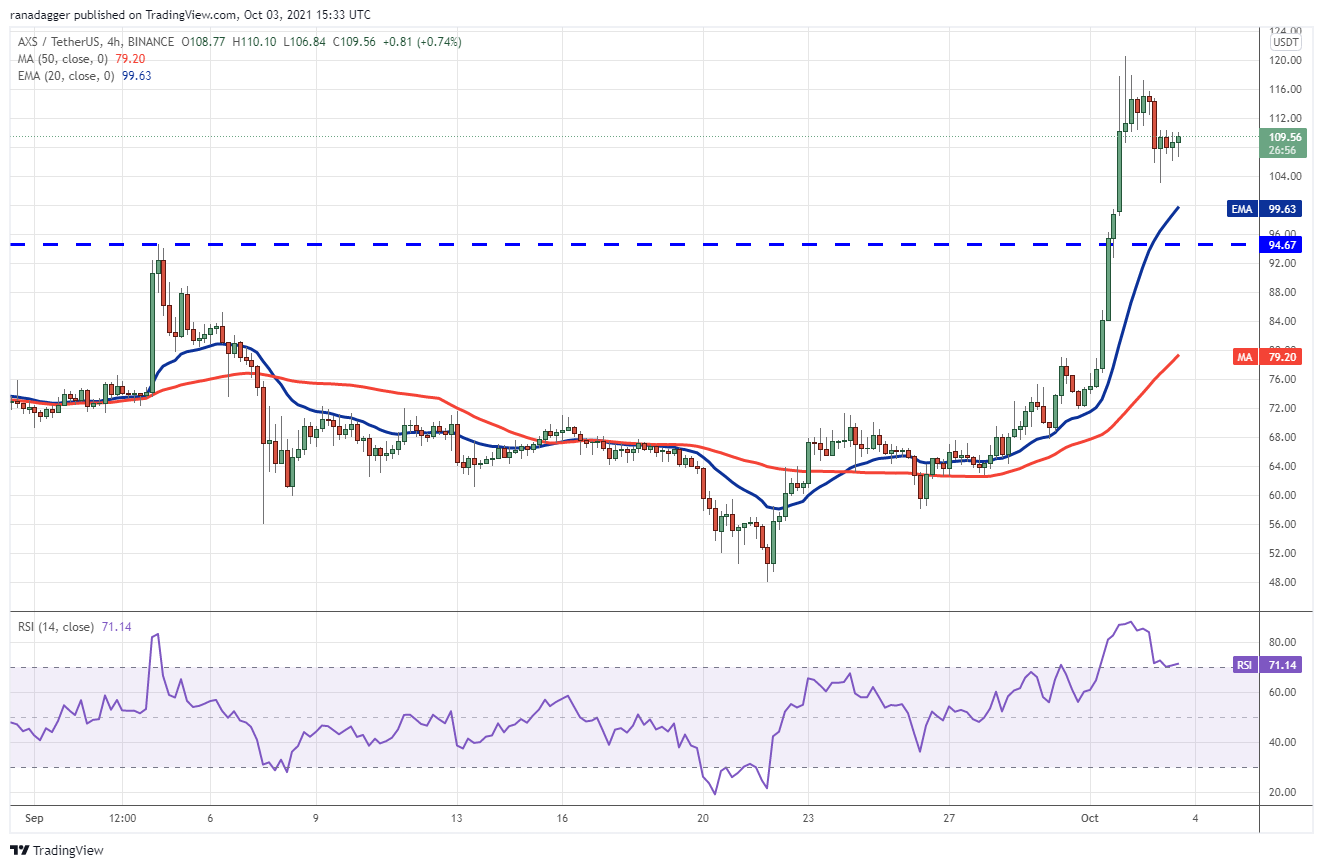
If buyers push the price above $110.50, the pair could retest the critical resistance at $120.57. A break and close above this level could signal the resumption of the uptrend.
On the other hand, if the price turns down from the overhead resistance, the pair may consolidate for some time before starting the next directional move. The first sign of weakness will be a break and close below the 20-EMA. Such a move will suggest that the bullish momentum has weakened and supply exceeds demand.
The views and opinions expressed here are solely those of the author and do not necessarily reflect the views of Cointelegraph. Every investment and trading move involves risk, you should conduct your own research when making a decision.

Leave A Comment