
Bitcoin (BTC) has given back some of its recent gains, but on-chain data resource Ecoinometrics said that whales are accumulating because they believe the price is attractive from a long-term perspective.
On the downside, analyst Willy Woo believes that $33,000 is a strong bottom for Bitcoin. Popular Twitter trader Credible Crypto citing data from PlanC said that the odds of Bitcoin declining below $30,000 are poor.

Could Bitcoin and altcoins stage a recovery after the recent pullback? Let’s study the charts of the top-5 cryptocurrencies that may attract investor attention in the short term.
BTC/USDT
Bitcoin turned down from the overhead resistance at $45,456 but a minor positive is that the bulls have not allowed the price to break below the 20-day exponential moving average ($41,383).

The pair could then rally to $52,088 where the bears are likely to mount a strong challenge. If bulls thrust the price above this level, the pair could start its northward march toward the pattern target at $56,904.
This positive view will be negated if the price breaks and sustains below $39,600. Such a move could open the doors for a possible drop to $36,250.

If the price turns down from the current level and breaks below $41,688.88, the pair could slide to $39,600. If the price rebounds off this level, then the pair could remain range-bound between $39,600 and $45,456 for a few days.
On the upside, a break and close above the moving averages will be the first indication that bulls have a slight edge. The pair could then rise to $43,920 and later to $45,456.
XRP/USDT
Ripple (XRP) broke and closed above the moving averages on Feb. 7, indicating that the downtrend could be coming to an end. The bears tried to pull the price back below the breakout level at $0.75 but the bulls thwarted their attempt.
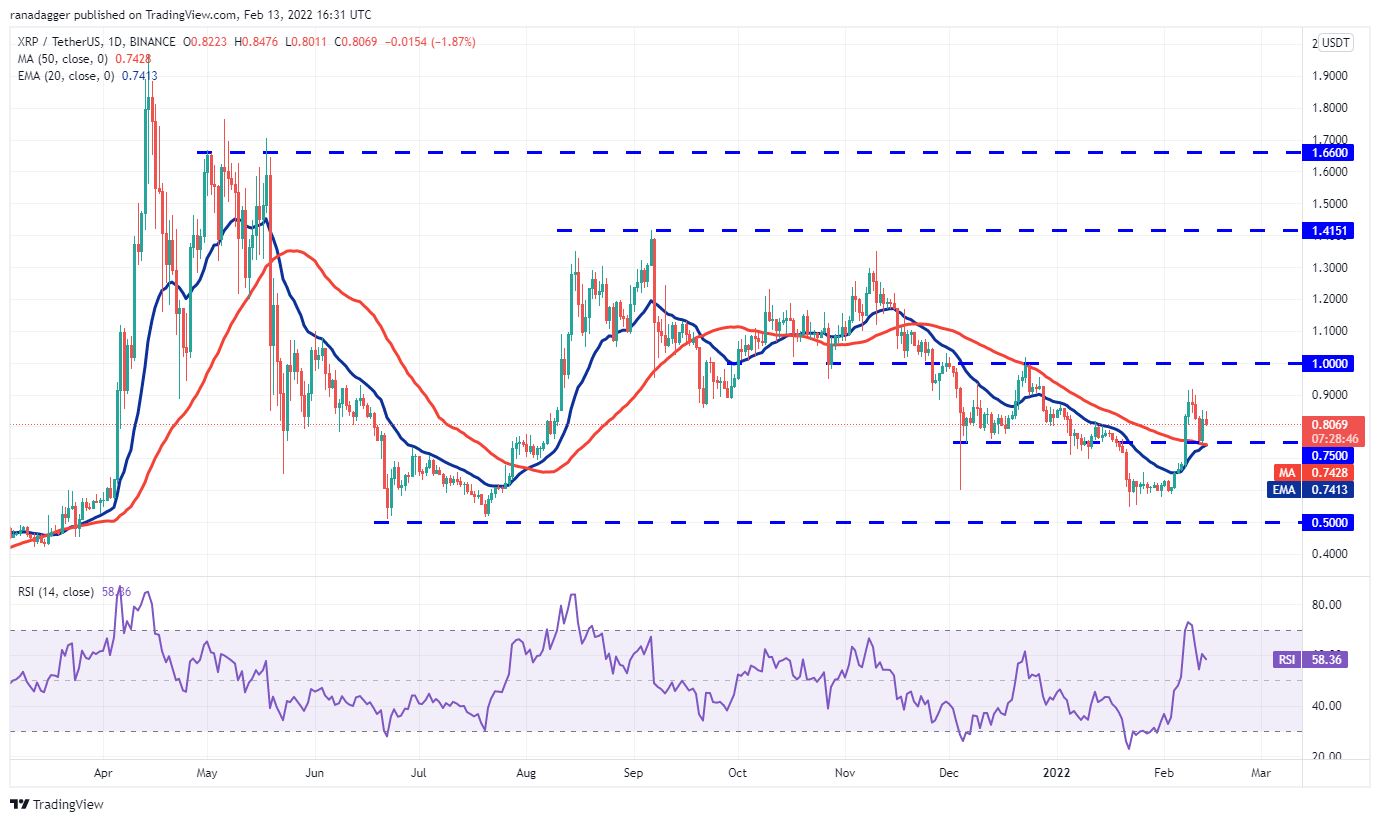
The moving averages are on the verge of a bullish crossover and the relative strength index (RSI) is in the positive zone, indicating that buyers have the upper hand. This positive view will invalidate on a break and close below $0.75. Such a move will indicate that bears continue to sell on rallies.

A minor positive is that bulls are buying the dips to the 50-SMA. If the price rebounds off this support, the bulls will try to drive the pair above $0.85 and challenge the resistance at $0.91. Conversely, a break and close below the 50-SMA could pull the pair to $0.75. A break and close below this support could indicate the start of a deeper correction.
CRO/USDT
Crypto.com’s native coin (CRO) broke above the 50-day SMA ($0.47) on Feb. 7, suggesting that the corrective phase could be over. The price rallied to $0.54 on Feb. 10 where the bears are mounting a strong defense.
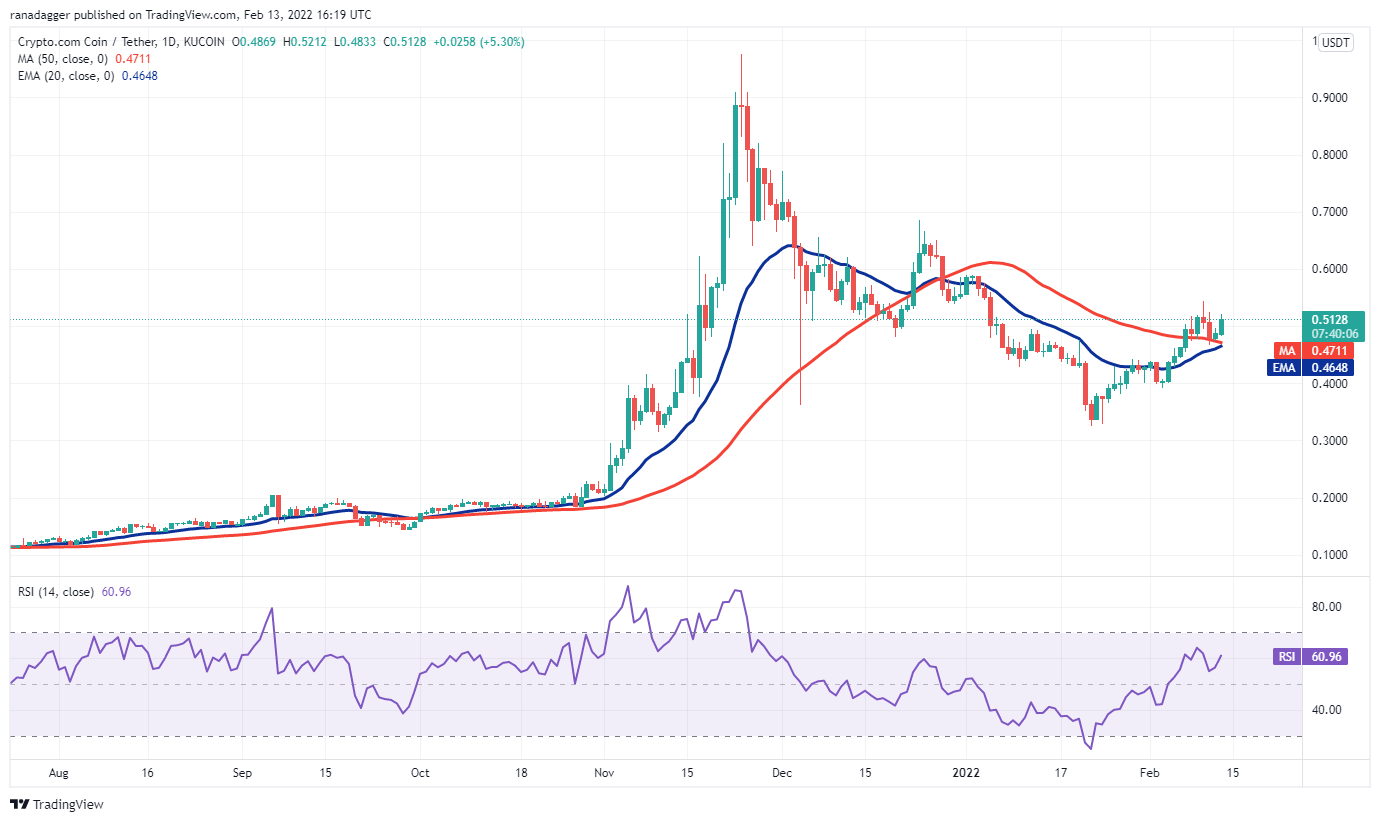
If they can pull it off, the CRO/USDT pair could rise to $0.60 and then to $0.68. Contrary to this assumption, if the price turns down and breaks below the 20-day EMA, the pair could drop to $0.39.

The buyers are attempting to defend the 50-SMA. If the price sustains above the 20-EMA, the bulls will again try to push the pair above the resistance line of the channel. This positive view will invalidate if the price turns down and plummets below the support line of the channel.
Related: Can XRP price reach $1 after 25% gains in one week? Watch this key support level
FTT/USDT
FTX Token (FTT) has been volatile inside a broadening formation. The failure of the buyers to propel the price above the resistance line indicates that bears are selling the rallies to this level.

If they manage to do that, the FTT/USDT pair could start a new uptrend. The pair could then rally to $53.50 where the bears may again pose a strong challenge but if this resistance is crossed, the rally could extend to $65.
This bullish view will invalidate if the price turns down and plummets below the 50-day SMA. That will indicate that the pair could extend its stay inside the broadening pattern for a few more days.
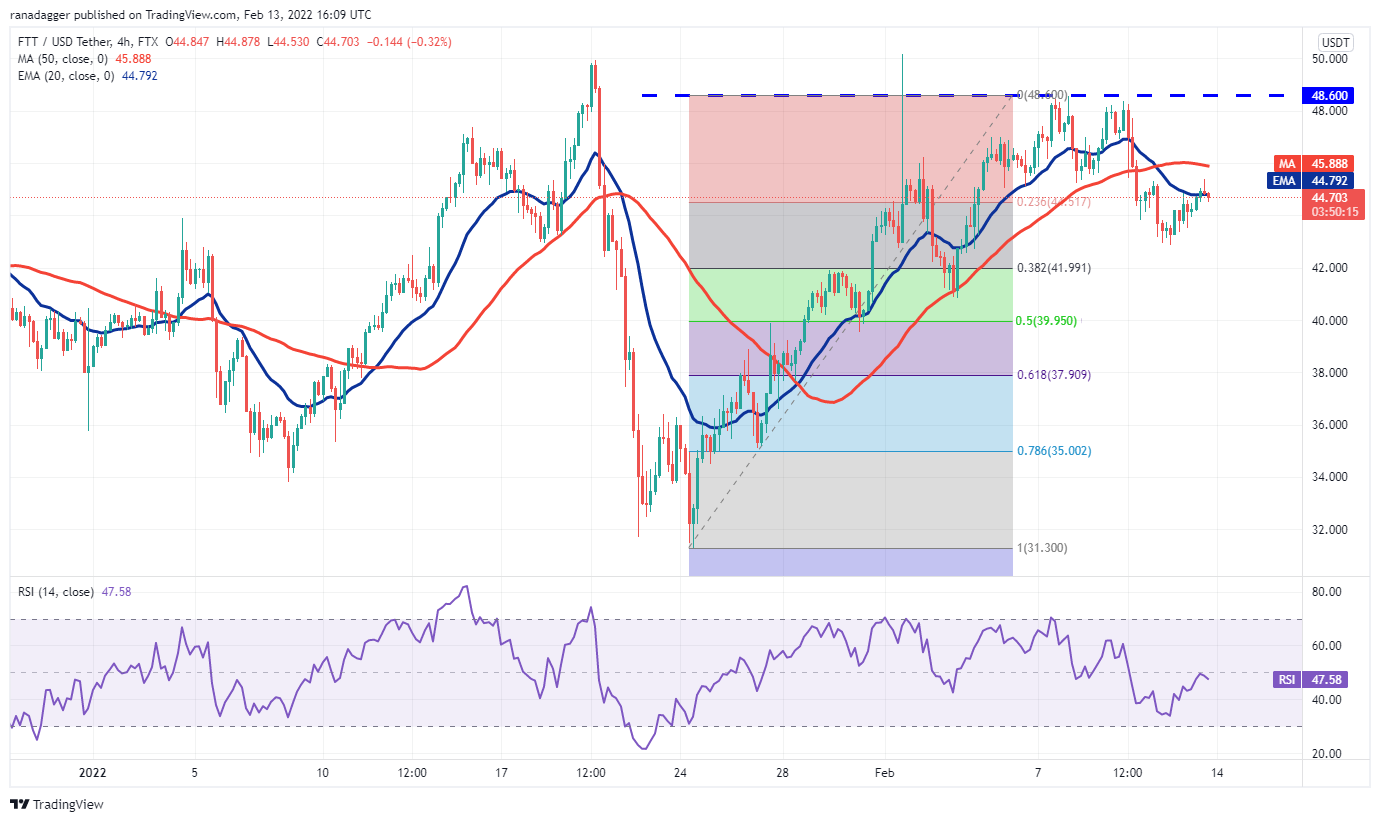
If the price rises from the current level or $41.99, it will suggest that buyers are accumulating on dips. The bulls will then again try to push the price above the 50-SMA. If they succeed, the pair could challenge the overhead resistance.
On the downside, a break and close below $41.99 could signal the start of a deeper correction to the 50% retracement level at $39.95.
THETA/USDT
Theta Network (THETA) broke and closed above the downtrend line on Feb.10, indicating that the downtrend could be coming to an end. Generally, a rally above a stiff resistance tends to turn back and retest the breakout level.

If the price rebounds off the downtrend line, the bulls will attempt to start a new uptrend. A break and close above $4.39 could attract further buying and the THETA/USDT pair could rise toward $6.
This bullish view will invalidate if the price turns down from the current level and plummets below the downtrend line. Such a move will suggest that the break above the downtrend line could have been a bull trap.

The price has bounced off the support line on three previous occasions hence, the bulls will again try to defend it. If the price rebounds off the level and rises above the downtrend line, it will signal the resumption of the uptrend.
Alternatively, a break and close below the support line of the channel could signal a deeper correction to $3.20.
The views and opinions expressed here are solely those of the author and do not necessarily reflect the views of Cointelegraph. Every investment and trading move involves risk, you should conduct your own research when making a decision.

Leave A Comment