
GBP/USD Daily Timeframe
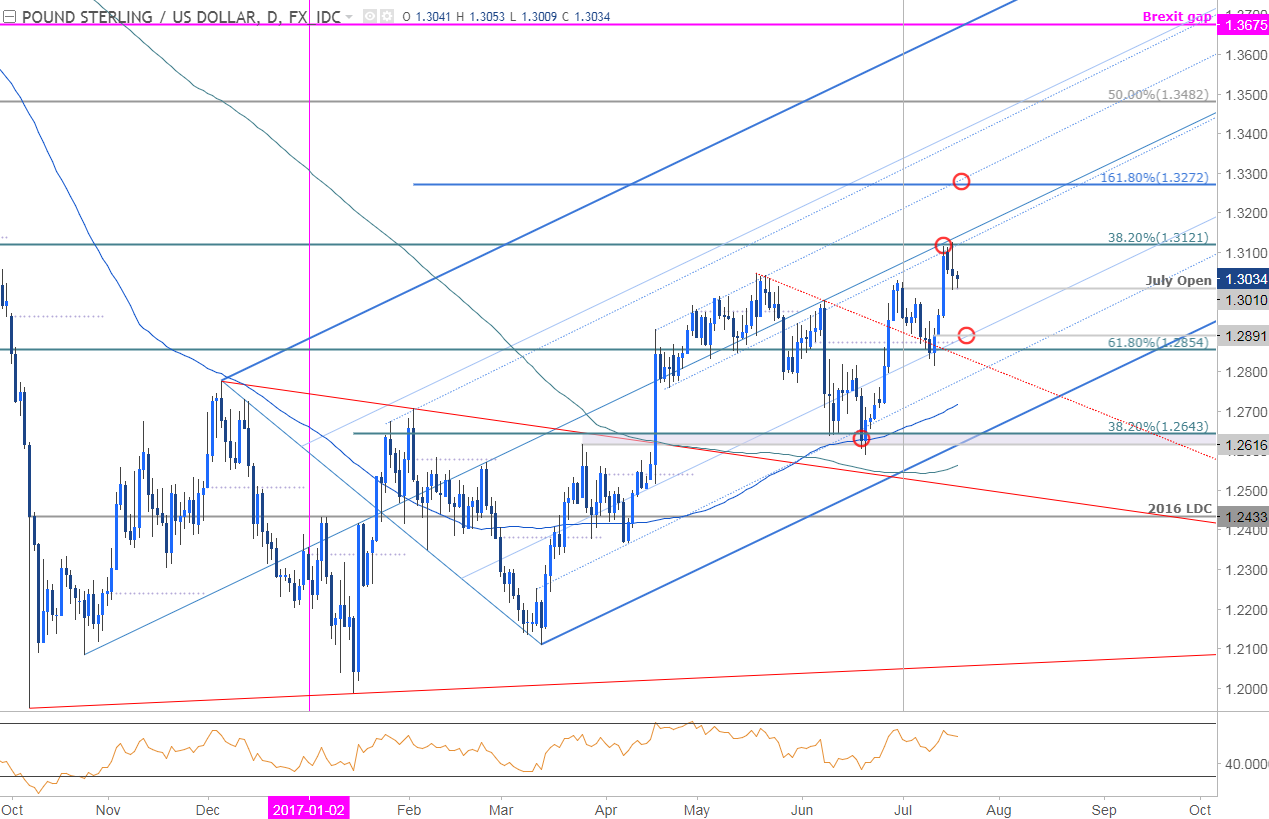
Technical Outlook: Sterling has been trading within the confines of this ascending pitchfork formation extending off the 2016 low with the rally encountering confluence resistance last week at the median-line / 38.2% retracement at 1.3121. Interim support rests with the monthly open with our broader focus higher in the pair while above 1.2854/91. A breach of the highs targets parallel resistance extending off the April highs, which converges on the 161.8% ext. of the 2017 advance at 1.3272.
GBP/USD 240min Timeframe
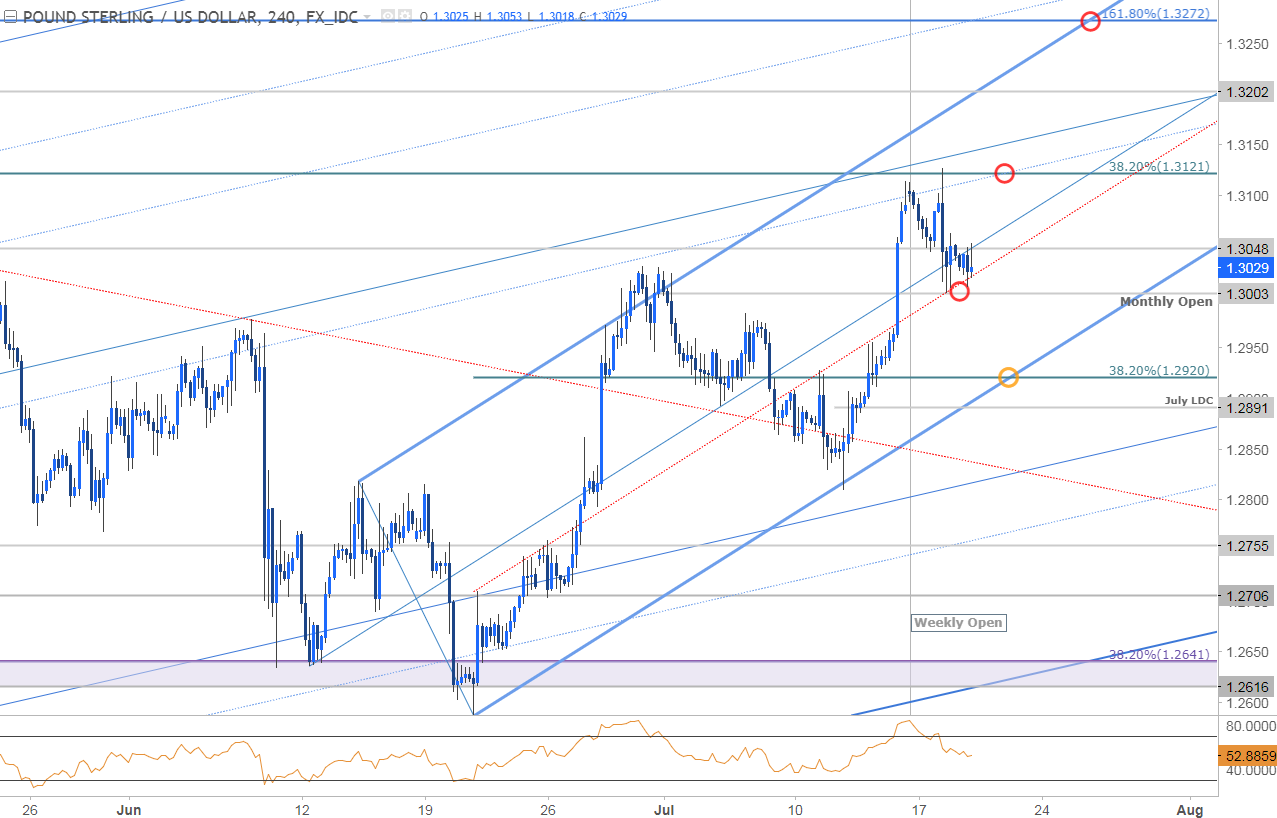
Notes: A closer look at the 240min chart highlights and embedded ascending formation we’ve been tracking off the June lows with price testing the median-line today in New York trade. From a trading standpoint, I’ll be looking for exhaustion / long-entries on a break lower with our focus higher while within this near-term formation.
A breach & retest of 1.3121 would validate the breakout with such a scenario targeting subsequent topside objectives at 1.3202 & the upper parallel / 1.3272. Added caution is warranted heading into UK Retail Sales tomorrow with the release likely to fuel increased volatility in the sterling crosses.


Leave A Comment