
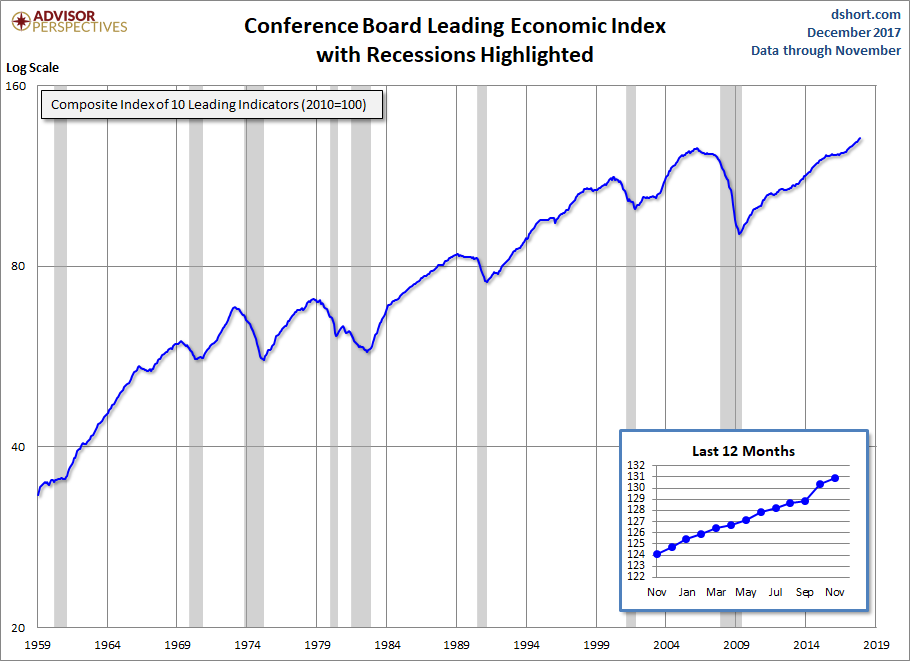
The latest Conference Board Leading Economic Index (LEI) for November increased to 130.9 from 130.4 in October. The Coincident Economic Index (CEI) came in at 116.5, up from the previous month.
The Conference Board LEI for the U.S. increased again in November, with positive contributions from the ISM® new orders, consumer confidence and the financial components more than offsetting the negative contributions from weekly initial claims for unemployment and building permits. In the six-month period ending November 2017, the leading economic index increased 3.0 percent (about a 6.1 percent annual rate), faster than the growth of 2.4 percent (about a 4.9 percent annual rate) during the previous six months. In addition, the strengths among the leading indicators have remained widespread. [Full notes in PDF]
Here is a log-scale chart of the LEI series with documented recessions as identified by the NBER. The use of a log scale gives us a better sense of the relative sizes of peaks and troughs than a more conventional linear scale.
For additional perspective on this indicator, see the latest press release, which includes this overview:
“The U.S. LEI rose again in November, suggesting that solid economic growth will continue into the first half of 2018,” said Ataman Ozyildirim, Director of Business Cycles and Growth Research at The Conference Board. “In recent months, unemployment insurance claims have returned to pre-hurricane levels. In addition, improving financial indicators, new orders in manufacturing and historically high consumer sentiment have propelled the U.S. LEI even higher.”
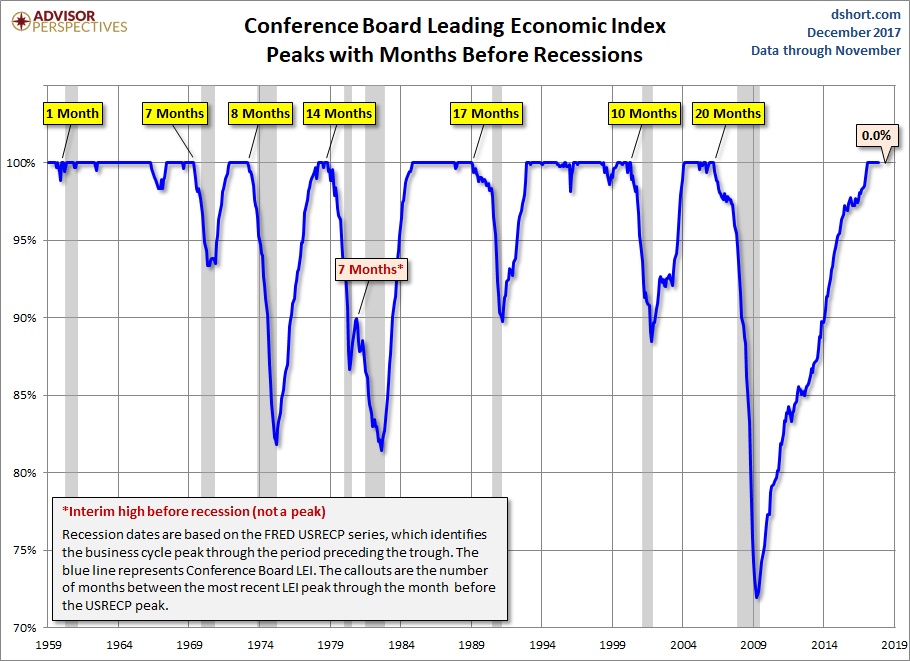
For a better understanding of the relationship between the LEI and recessions, the next chart shows the percentage-off the previous peak for the index and the number of months between the previous peak and official recessions.
LEI and Its Six-Month Smoothed Rate of Change


Leave A Comment