

EUR/USD appears to be on track to test the September-high (1.2092) as it extends the advance from the previous week, but key data prints coming out of Europe may rattle the near-term rally in the exchange rate as the European Central Bank (ECB) struggles to achieve the 2% target for inflation.
Updates to the Euro-Zone Consumer Price Index (CPI) may produce a bearish reaction in EUR/USD as the headline reading is projected to slow to an annualized 1.4% from 1.5% in November, but a pickup in the core rate of inflation may keep the single-currency afloat as it encourages the ECB to move away from its easing-cycle.
Even though the Governing Council remains in no rush to remove the zero-interest rate policy (ZIRP), recent comments from ECB officials suggest the central bank will continue to change its tune in 2018 as Yves Mersch notes that the executive board must be ‘very careful not to act too timidly and too late and to fall behind the curve,’ while Benoit Coeure argues that ‘markets have to understand that QE will not last forever.’ Gradual changes to the forward guidance for monetary policy may fuel the appreciation in EUR/USD, with market participants likely to comb the ECB policy meeting minutes for clues as the central bank starts to wind down its asset-purchase program.
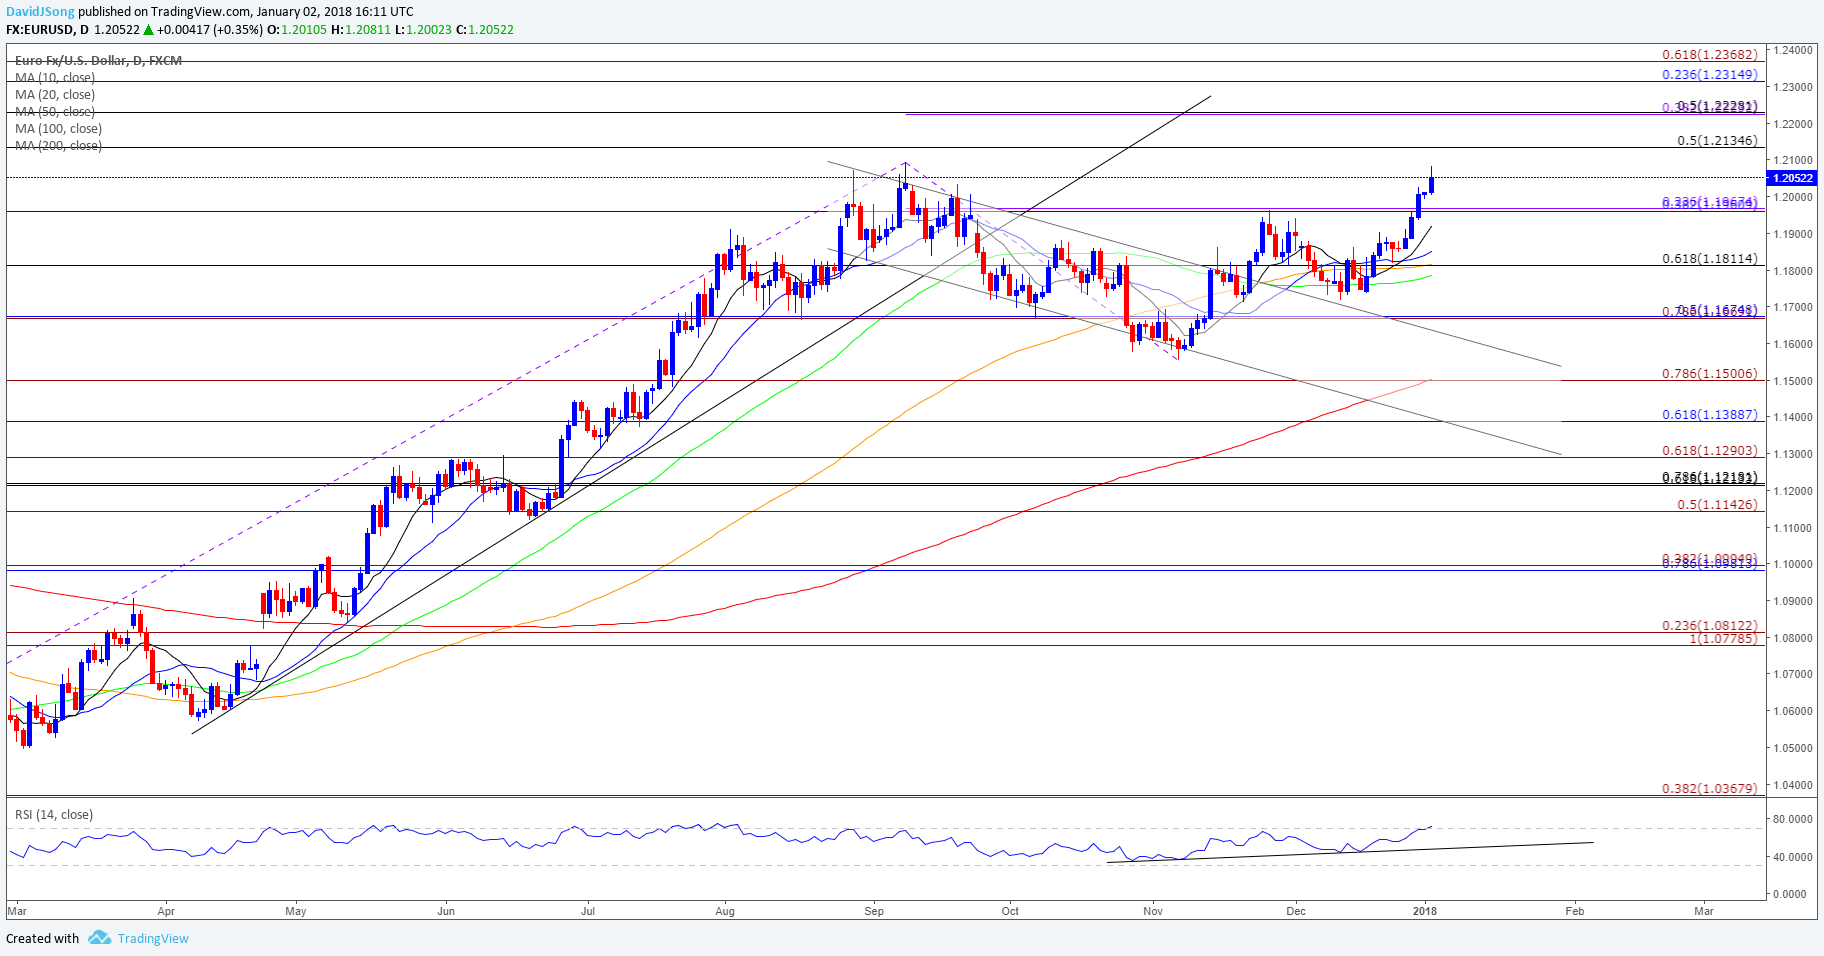
In turn, EUR/USD may continue to retrace the decline from back in 2014, with the topside targets on the radar especially as the bullish momentum appears to be gathering pace. After a string a failed attempts to break above 70, the Relative Strength Index (RSI) appears to be pushing into overbought territory for the first time since the summer months, with the yearly opening range in focus as a bull-flag formation appears to be panning out.Want to learn more about popular trading indicators and tools such as the RSI?
EUR/USD Daily Chart


Leave A Comment