Fed chair Janet Yellen keeps repeating the mantra “inflation expectations are well anchored”.
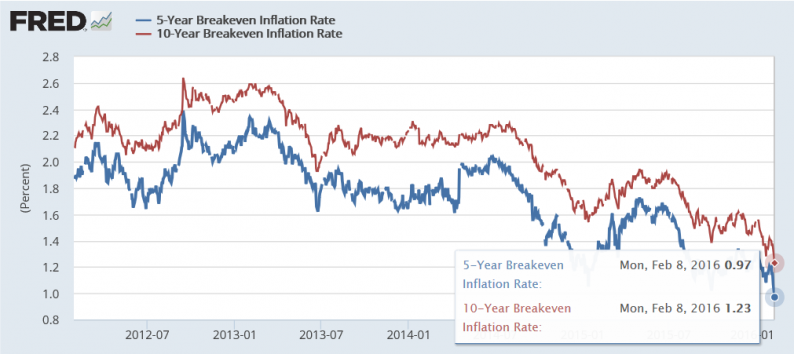
They’re not, and I can prove it with a pair of chart on 5-year and 10-year “breakeven” interest rates. The breakeven rate is the difference in yield between inflation-protected and nominal debt of the same maturity.
Falling breakeven rates indicate decreasing expectations of future inflation.
5-Year and 10-Year Breakeven Rates 2012-Present

5-Year and 10-Year Breakeven Rates 2006-Present

What Me Worry?
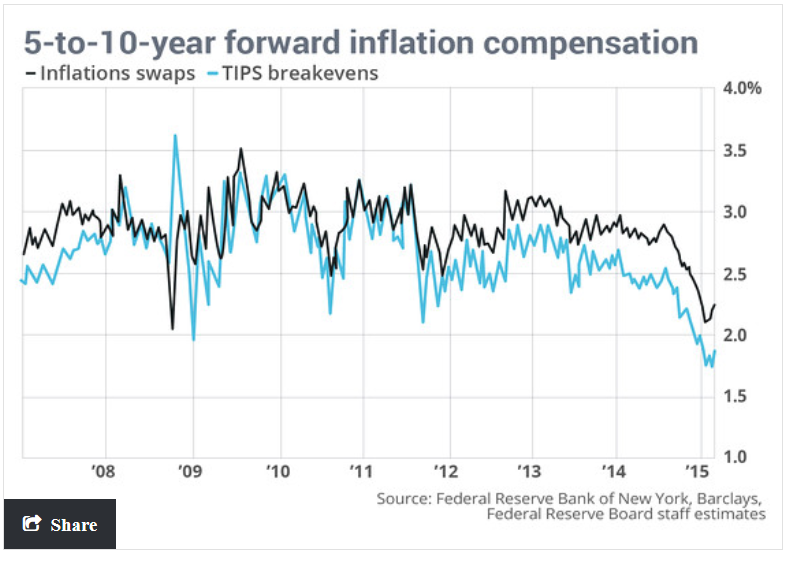
Earlier today, MarketWatch economic director Steve Goldstein posted a chart of breakeven rates and inflation swaps with the headline Here’s Why the Fed Doesn’t Trust This Chart.
Curiously, the chart was from a year ago and so was Goldstein’s analysis.
I was wondering why the chart stopped in February of 2015. The reason came moments later when the article referred to Fed testimony not today, but also a year ago.
Yet Fed officials — notably Fed Chairwoman Janet Yellen — say that inflation expectations are stable.
In a section of the Fed’s semi-annual report on monetary policy released Wednesday, the central bank explains why they don’t believe this chart reflects a real decline in inflation expectations: The spreads pictured in the chart also bake in an inflation-risk premium, as well as other premiums driven by liquidity differences.
The Fed notes that surveys from primary dealers find their inflation expectations have been basically stable since last summer. Professional forecasters, too, haven’t changed their expectations much.
The article to which Goldstein referred was the Monetary Policy Report submitted to the Congress on February 24, 2015.
February 10, 2016 Speech
Goldstein is correct in his statement the Fed is not worried, even though he has the wrong year. Here is a snip from Chair Janet Yellen’s Semiannual Monetary Policy Report to Congress Before the Committee on Financial Services, U.S. House of Representatives, Washington, D.C. February 10, 2016.


Leave A Comment