
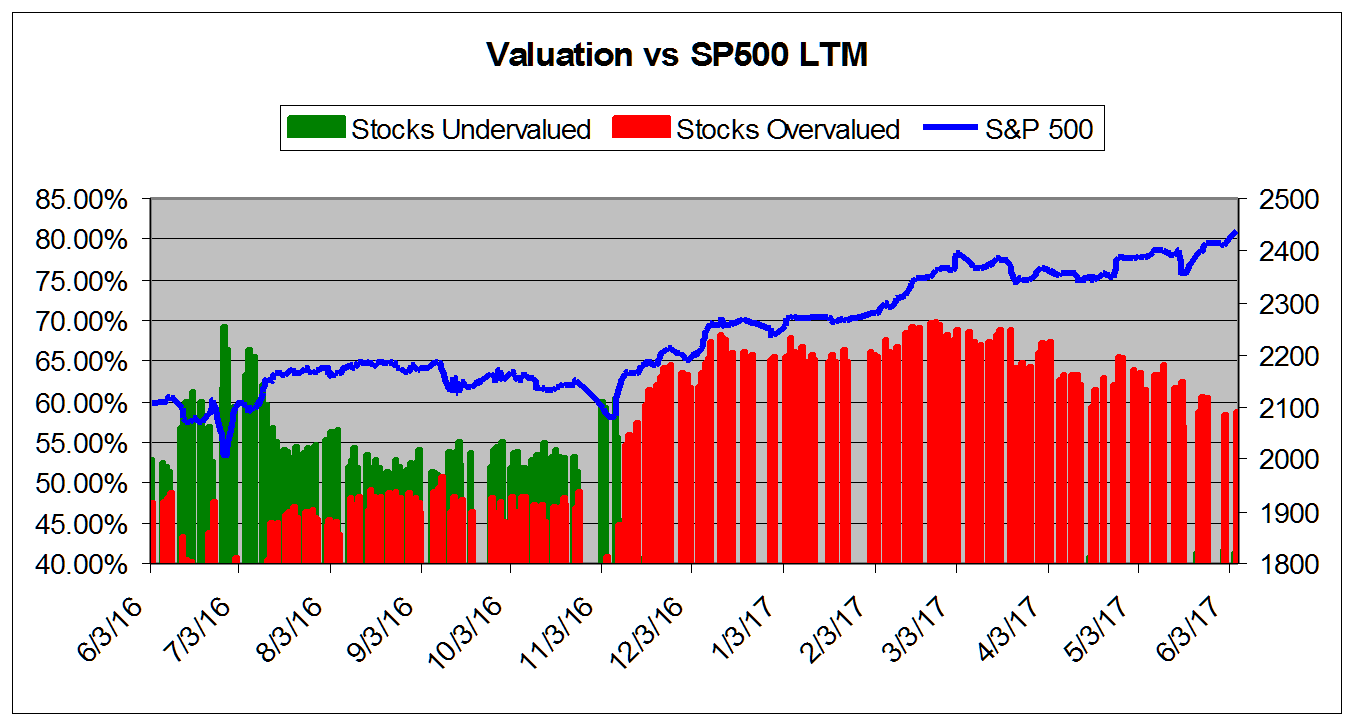
We now calculate that 58.8% of the stocks to which we can assign a valuation are overvalued and 22.6% of those stocks are overvalued by 20% or more. These numbers are running below what we saw when we published our last valuation study in April. Since that time, we have removed our overvaluation watch.
We fell below the critical 60% threshold for an overvaluation watch for the first time on May 18th, this was after numbers fell below the warning level back in April. We have seen some fluctuation, with short stints above 60% since then, but the trend is clear at this point: lower overall valuations.
The models have responded positively to the end of the so-called “Trump Rally” where investors seemed to have believed campaign rhetoric about lower taxes, increased infrastructure spending, etc. that made up a large part of the current president’s campaign speeches.
The failure of Trump to successfully implement any major agenda items via legislation–despite controlling both houses of Congress, may have provided a much-needed “reality check” to those inclined to believe the rhetoric, rather than the reality in Washington DC.
We have yet to see any indication whatsoever that the current occupant of the White House possesses the ability to get his legislative agenda–such as it exists–through the Congress and into law. That means the much-anticipated economic stimulus of the proposed plans may never appear.
So, stocks have come back to earth a bit from a valuation perspective–despite indices that keep making record highs. This is a good thing because earnings are now more in line with prices. Credit the continuing good news on the economic front for this development rather than any actions in DC.
The chart below tracks the valuation metrics from June 2016. It shows levels in excess of 40%.
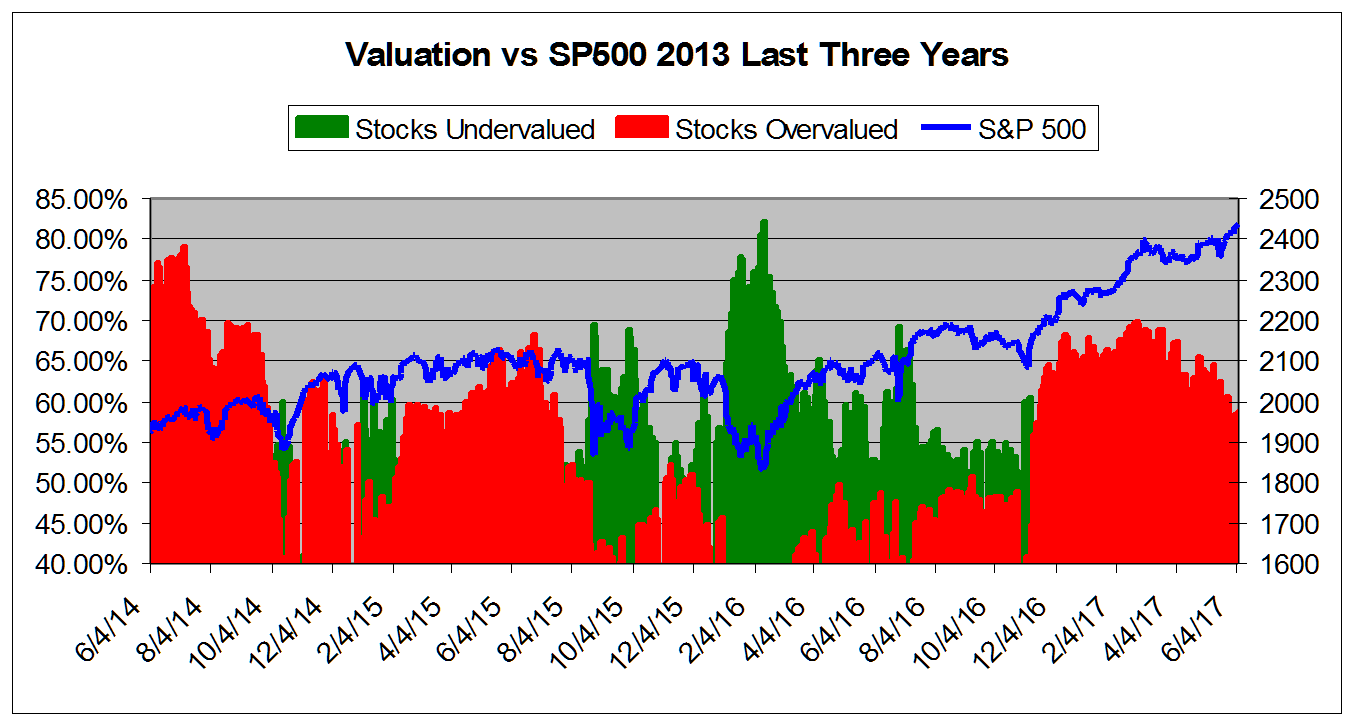
This chart shows overall universe over valuation in excess of 40% vs the S&P 500 from June 2014


Leave A Comment