While the release of the Federal Reserve’s meeting minutes on Wednesday of last week was supposed to be catalytic, the market seemed a little disappointed – and disinterested – in the fact that Janet Yellen and her cohorts didn’t really say much (or decide much) of anything during last month’s gathering. It wasn’t until Friday’s news that Europe as well as China would be issuing new stimulus that we saw U.S. stocks start to move. But, move they did, with the S&P 500 (SPX) (SPY) hitting record highs in the process.
The overall trend for stocks remains positive, for the time being. We’ll take a look at the bigger market picture right after we take a closer look at last week’s economic reports. Lastly, we look at the big picture view of Crude Oil and the Dollar Index, both of which are around possible reversal areas.
Economic Data
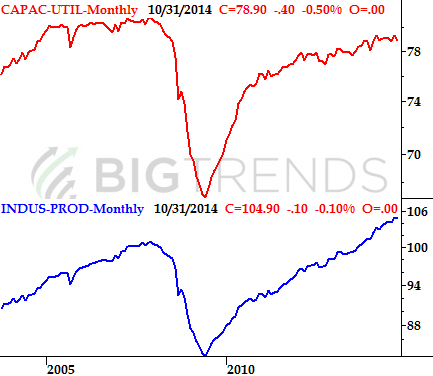
We worked our way through a pretty big dose of economic information last week, and it was mostly good. We didn’t start the week out on the strongest foot though, with less-than-stellar industrial production and capacity utilization numbers. Industrial production numbers fell 0.1% in October, and capacity utilization fell from 79.2% to 78.9%.
As our chart indicates, neither lull is a trend-breaker. On the other hand, no trend is dramatically big when it first develops.
Industrial Productivity & Capacity Utilization Chart

Source: Federal Reserve
From that point forward, the news turned relatively encouraging, especially for real estate. The NAHB Housing Market Index rose from 54 to 58 for November, and existing home sales reached a new multi-month high pace of 5.26 million. Housing starts for October fell from September’s pace, but the 1.009 million units is still solid. Building permits grew from 1.031 million to 1.080 million units for last month. The bigger trend remains positive.


Leave A Comment