
Equity markets rallied around the globe today. Before the US markets opened, the Shanghai Composite had posted a 1.68% gain, European indexes were strong, and the Euro STOXX 50 would ultimately close with a 1.72% advance. The S&P 500 opened higher and rose steadily through the day to close at its intraday high, up 2.39%. This was the second largest gain of 2016, a tad behind the 2.48% gain that closed out January.
The yield on the 10-year note closed at 1.83%, up nine basis points from the previous close.
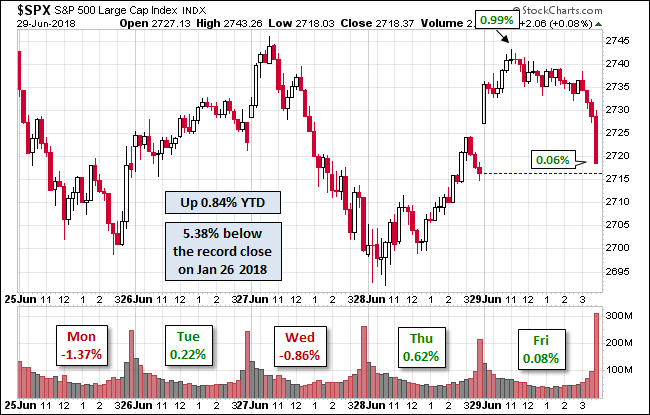
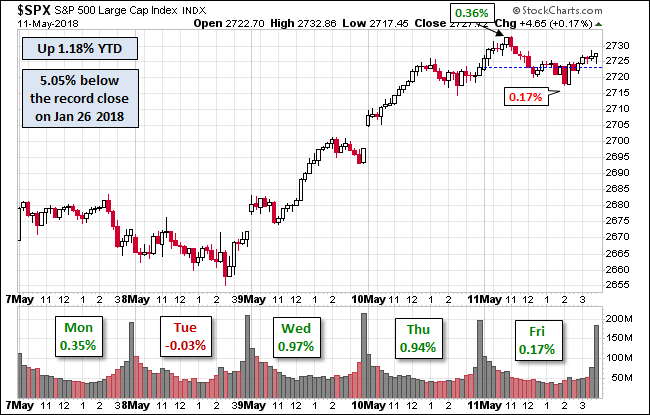
Here is a snapshot of past five sessions in the S&P 500.
Here is a daily chart of the index. Volume was unremarkable, but a bit higher than during the preceding two-day selloff. We can see the the S&P 500 is now back above its 50-day price moving average.
A Perspective on Drawdowns
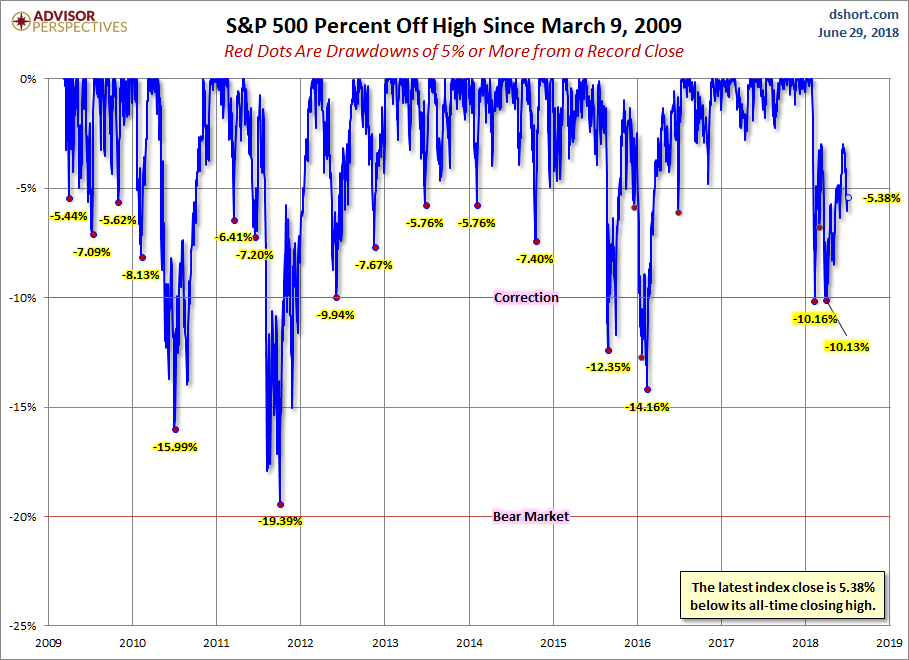
Here’s a snapshot of selloffs since the 2009 trough.
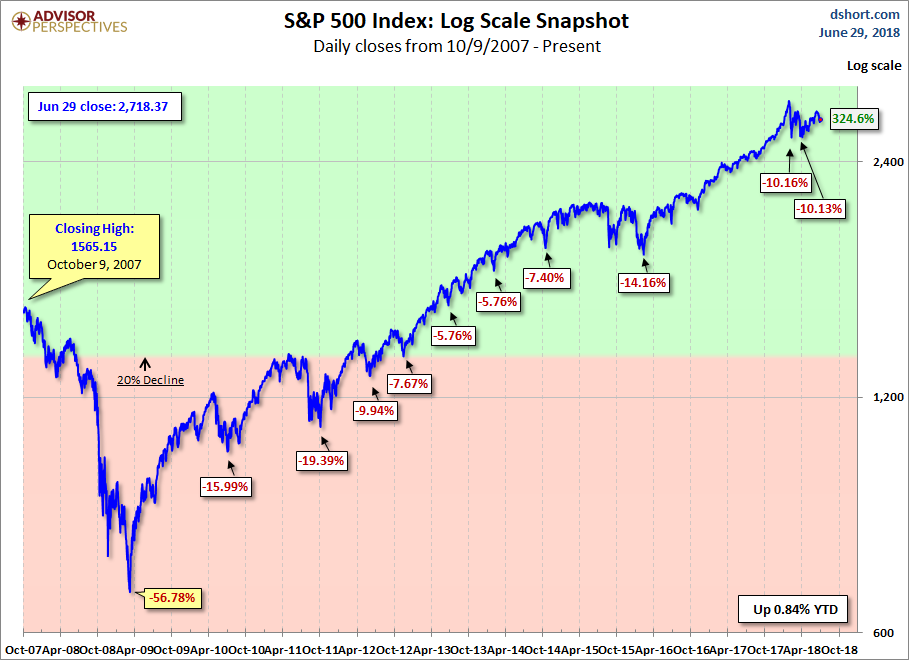
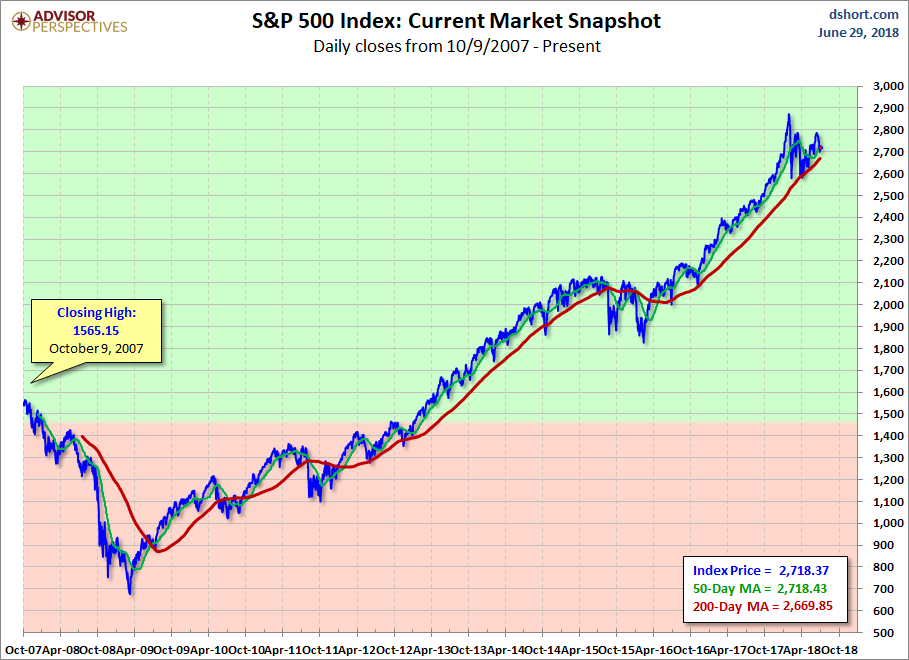
Here is a more conventional log-scale chart with drawdowns highlighted.
Here is a linear scale version of the same chart with the 50- and 200-day moving averages.
A Perspective on Volatility
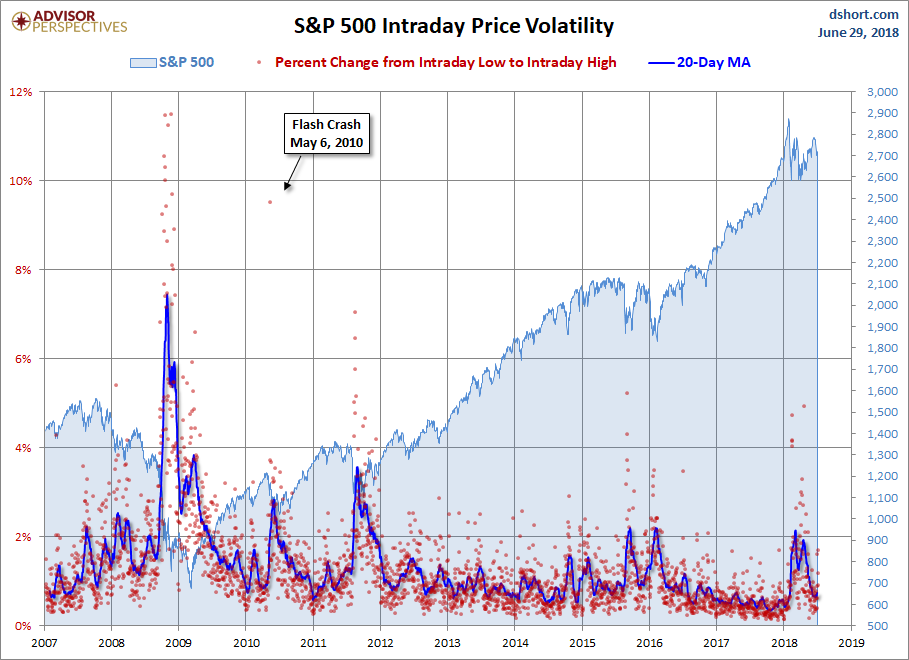
For a sense of the correlation between the closing price and intraday volatility, the chart below overlays the S&P 500 since 2007 with the intraday price range. We’ve also included a 20-day moving average to help identify trends in volatility.


Leave A Comment