In their seminal 1993 paper, “Returns to Buying Winners and Selling Losers: Implications for Stock Market Efficiency,” Narasimhan Jegadeesh and Sheridan Titman reported signi?cant returns to buying winners and selling losers in the U.S. equity market, now referred to as the “cross-sectional momentum anomaly.”(1) In 1997, Mark Carhart, in his study “On Persistence in Mutual Fund Performance,” created a factor based on cross-sectional (or relative) momentum, together with the three Fama-French factors (market beta, size, and value), to explain mutual fund returns. Subsequently, the momentum factor was often used by academic researchers and practitioners as a supplement to the workhorse Fama-French three-factor model as the fourth factor used in standard asset pricing models.(2)
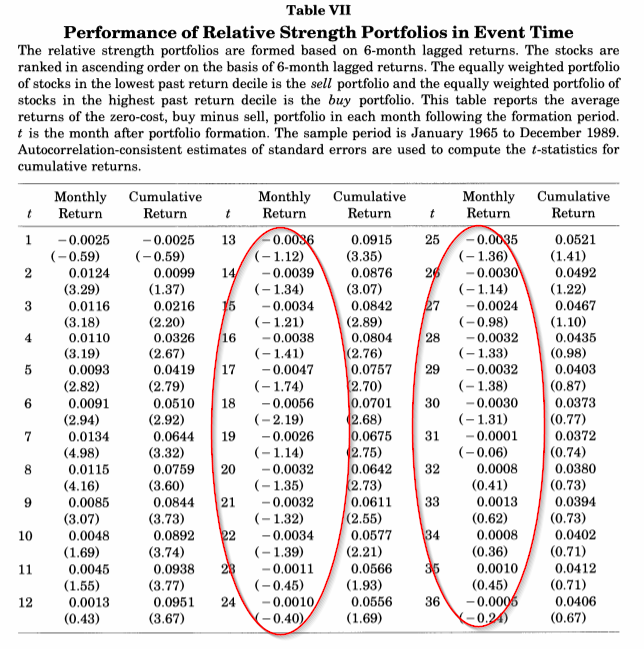
A less famous, though equally important, price pattern was also found in the original Jegadeesh and Titman paper — long-term reversals. For example, in Table 7 from the original paper, the authors highlight the “U” shape of momentum returns:

The results are hypothetical results and are NOT an indicator of future results and do NOT represent returns that any investor actually attained. Indexes are unmanaged, do not reflect management or trading fees, and one cannot invest directly in an index.
Whereas prices are characterized by momentum over the short run of three to 12 months, prices reverse over the long run (beyond the first year). While the academic literature demonstrates that individual investors tend to be performance chasers, there’s a strong body of evidence documenting the reversal of long-term stock returns. For example, in the study “Does the Stock Market Overreact?”, which appeared in the July 1985 issue of the Journal of Finance, authors Werner F.M. De Bondt and Richard Thaler documented the reversal of long-term stock returns.(3) De Bondt and Thaler found that for U.S. stocks classified based on their returns over the past three to five years, “losers” outperform “winners” over the following three to five years. De Bondt and Thaler, as well as other researchers, attribute this long-term return reversal to investor overreaction. This, of course, is a challenge to the notion of market efficiency. Today, quantitative investment firms focused on momentum strategies incorporate reversals into their momentum strategies: most of their models focus on momentum formation periods in the three to 12-month range.(4)
Momentum and Reversals: The International Evidence
Douglas W. Blackburn and Nusret Cakici contribute to the literature on reversals with their study “Overreaction and the Cross-section of Returns: International Evidence,” which appears in the June 2017 issue of the Journal of Empirical Finance. (shorter summary is available here). They investigated whether the price reversal pattern is present in global equity markets. Importantly, their dataset included equity returns from 23 developed countries categorized into the regions of North America, Europe, Japan and Asia over the period from 1993 through 2014. Thus, they provide an out-of-sample test, both in time and geography, of the findings of Jegadeesh and Titman.
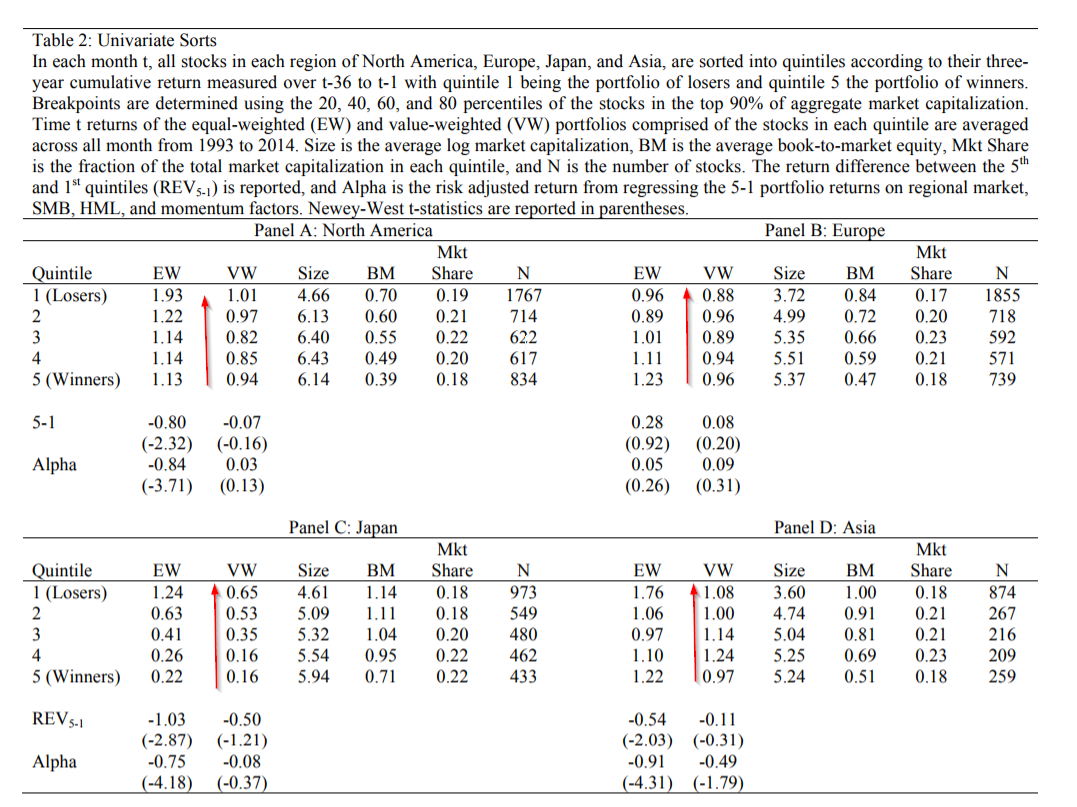
For example, the following table highlights univariate sorts on three-year momentum portfolios:
The results are hypothetical results and are NOT an indicator of future results and do NOT represent returns that any investor actually attained. Indexes are unmanaged, do not reflect management or trading fees, and one cannot invest directly in an index.
Besides Europe, the evidence generally supports the notion that three-year losers tend to be winners and three-year winners tend to be losers, highlighting the well-established long-term reversal phenomenon.


Leave A Comment