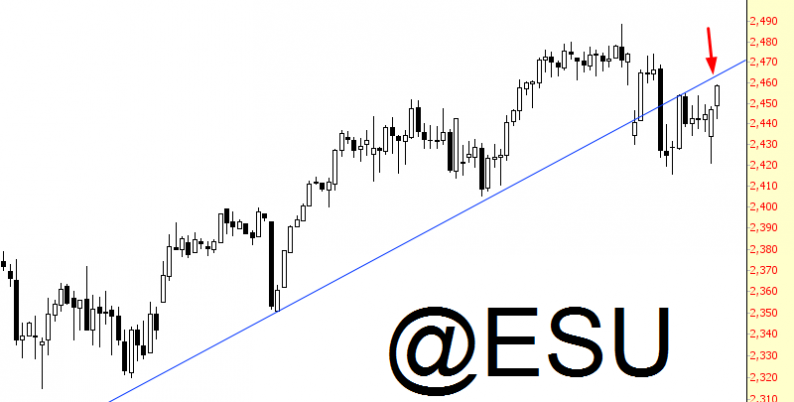
The ES has rocketed (which is appropriate, given the missile threats) higher lately, and we’re getting very close to the underbelly of that broken trendline. Umm, if the market wouldn’t mind, this would be a pretty good place to slow down and reverse.

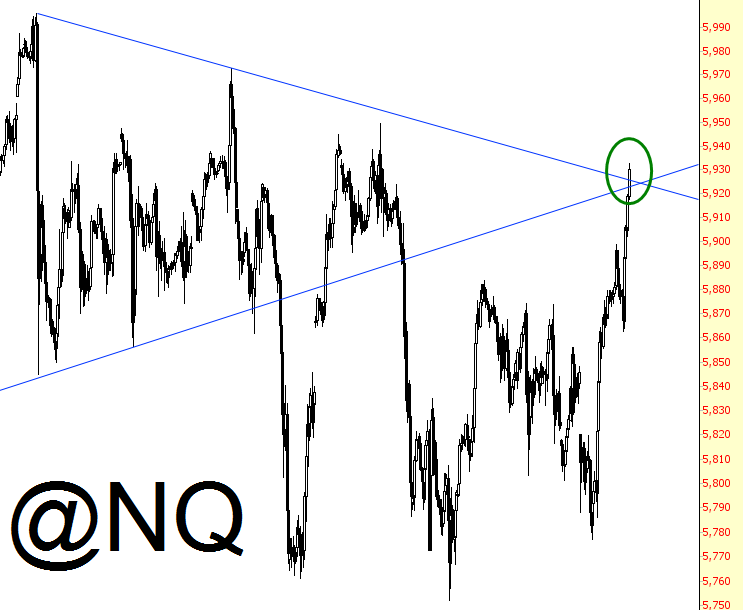
Looking at things a bit differently, here is the NQ on an intraday basis for the past few months. Having broken down beneath its symmetric triangle, it has come full circle (just to mix metaphors) and is exactly at the apex. If nothing else, it’s geometrically interesting.
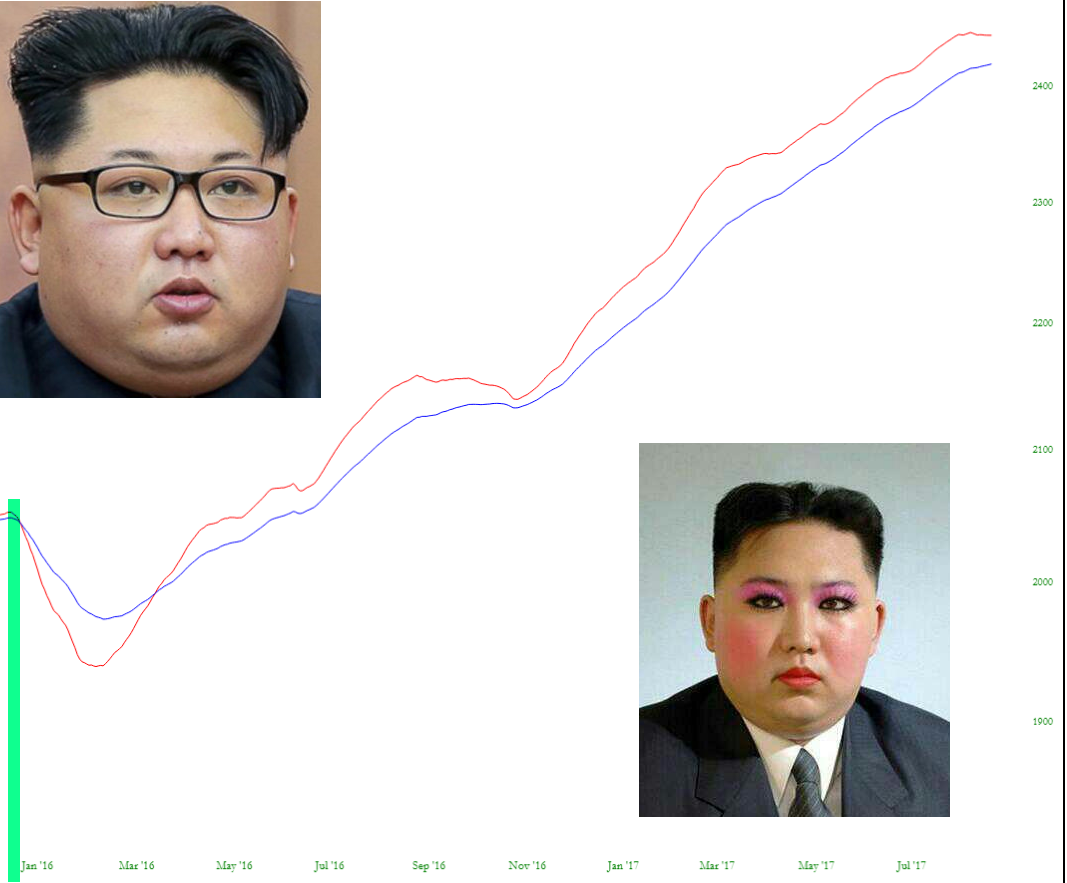
As you can see, the faster-moving red average has persistently stayed above the 100 for a very long while, its most recent breach way back in December 2015 (tinted in green). This isn’t anywhere close to a crossover yet.


Leave A Comment