The “most-watched datapoint in history” just hit… and everything is hotter than expected…
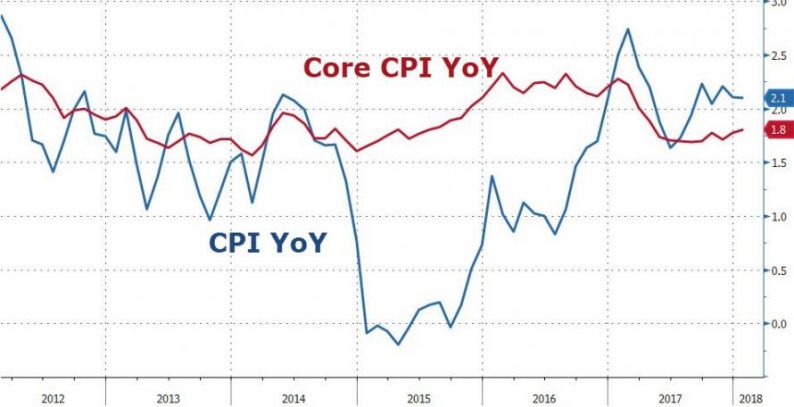
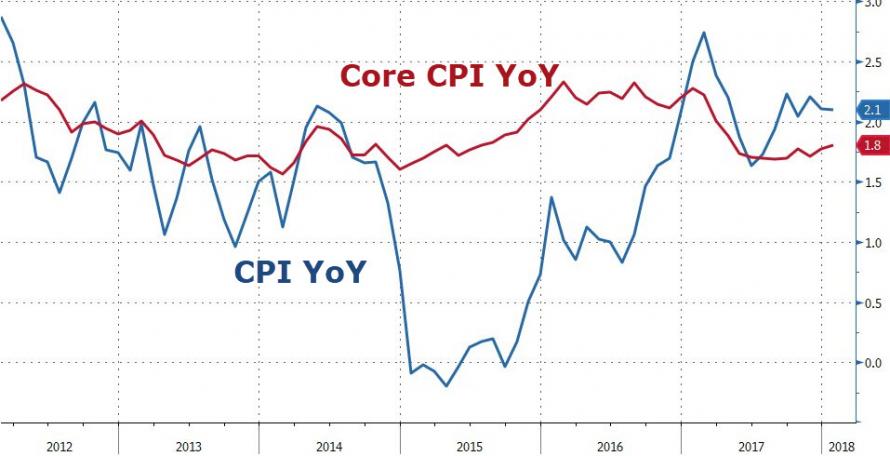
Amid updated seasonal adjustments from BLS and strong base effects, Headline CPI printed a much hotter-than-expected 2.1% YoY (1.9% YoY exp)
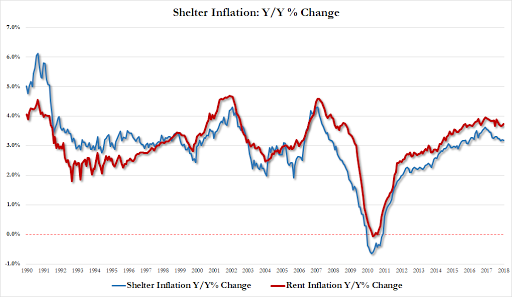
The index for all items less food and energy increased 0.3 percent in January. The shelter index increased 0.2 percent as the indexes for rent and owners’ equivalent rent both rose 0.3 percent, while the index for lodging away from home declined 2.0 percent over the month.
The apparel index rose sharply in January, increasing 1.7 percent after falling in previous months. The medical care index increased as well, rising 0.4 percent. The index for hospital services increased 1.3 percent, and the physicians’ services index rose 0.3 percent; the index for prescription drugs, however, declined 0.2 percent.
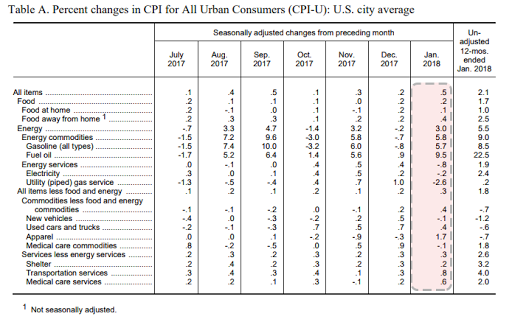
The index for motor vehicle insurance continued to rise in January, increasing 1.3 percent, its largest 1-month increase since November 2001. The personal care index rose 0.5 percent; this was its largest increase since January 2015. The used cars and trucks index also continued to rise, advancing 0.4 percent in January. The indexes for household furnishings and operations, education, and tobacco also increased in January.
A few indexes declined in January, including airlines fares, which fell for the third consecutive month, decreasing 0.6 percent. The new vehicles index decreased 0.1 percent. The indexes for recreation, communication, and alcoholic beverages were all unchanged in January.
* * *
The reaction is obvious – bond yield surging (prices tumble) and stocks drop…
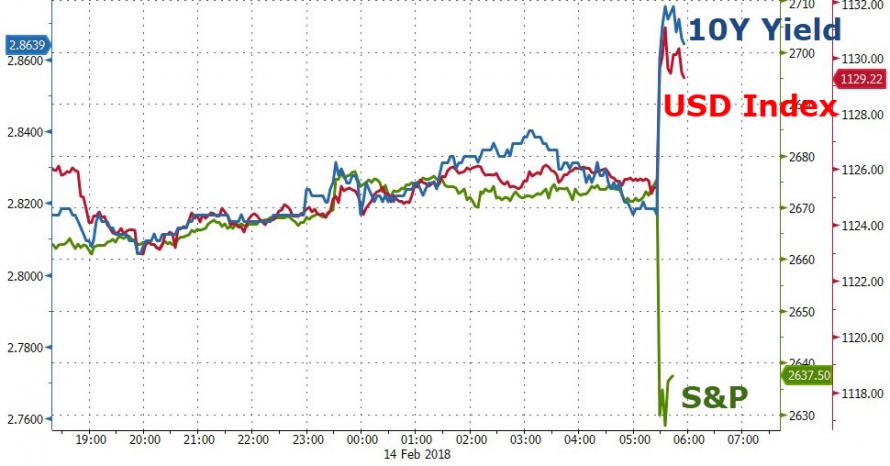
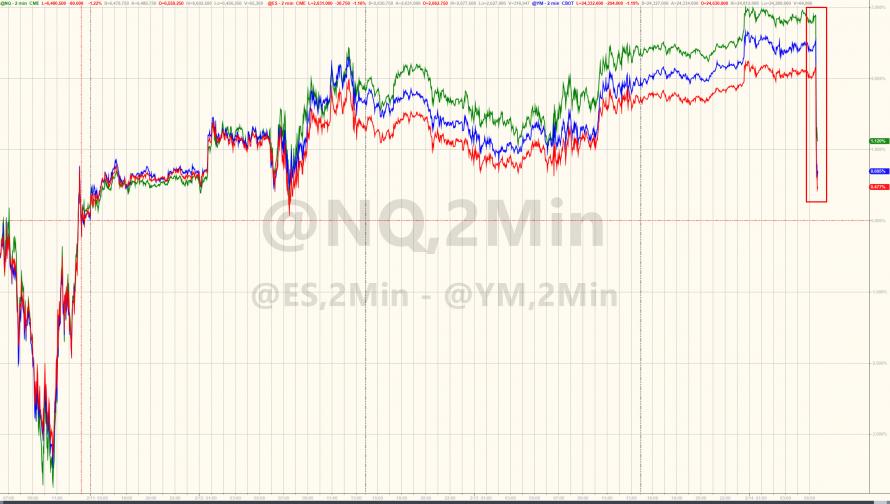
Equity Futures are down across the board…
10Y Yields are spiking..

The Dollar is spiking…

As Bloomberg’s Richard Breslow warned yesterday:


Leave A Comment