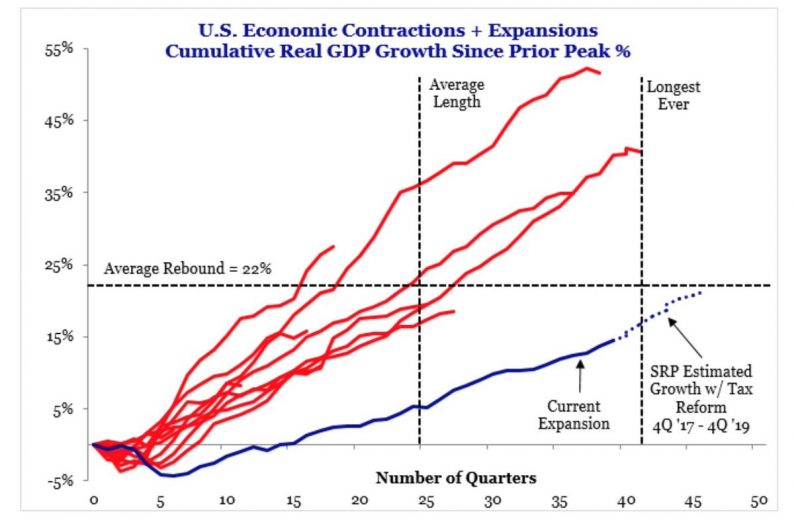
Over the long-term, markets take money from those with lazy/poor analysis and give it to those who do rigorous analysis and stick with it. In the past few years, there have been some prognosticators who claimed the economy was ‘due for a recession’ because there usually is one about every 6 years. That’s a lazy perspective to have because most expansions have been shorter or longer than the average. As you can see in the chart below, few of the lines end near the average length. Rigorous analysis tells you that business cycles don’t have a static time clock they must obey. There are dynamic effects that cause cycles to vary in length.

It Has Been A Long Weak Expansion
The chart depicts the current cycle as the blue line. A quick look at the cycle shows the total growth hasn’t even reached the size of the average cycle even though it’s the 3rd longest since 1854. Instead of growing fast enough to pick up inflation which leads to a recession, growth has been so low that deflation has been a greater force on the economy. Even with the boost from tax cuts, this expansion will be the longest one before it gets to the average total growth. Regardless of length and total growth, the variable to watch in 2018 is how much growth accelerates and if it causes inflation. That will put the economy in a truly late cycle state. That’s a noteworthy point because many analysts have been claiming the economy is late-cycle just because the expansion is old. A good analogy for this is the difference between a 70 year old man who can barley walk and one who runs a 5K every week. Age isn’t a great depicter for how healthy someone is and the age of the business cycle isn’t a great help to figuring out which stage it’s in.
2-3 Years Until Next Recession?
Since the averages don’t tell us much about when the next recession will come, what does? The best way to time future recessions is by looking at the economy from the top down to compare various metrics to previous cycles. One indicator is the output gap. The chart below shows the yield curve, which is another indicator. The yield curve has been tracking the average of prior cycles very closely in the past 2 years. If the Fed follows along with its guidance of raising rates 75 basis points in 2018, it will likely flatten the yield curve.


Leave A Comment