There seems to be a crescendo of corruption and a storm of deceitfulness rising all around us. How we react to these trials of the day will determine many things, not the least of which is the choice of whom
March 16, 2018

A mixed shop for Asian indices with most playing either side of unchanged for much of the day. The Nikkei opened with a small gain but was again soon under pressure as continued trade war fears and US political concerns

A review of the day’s trading in the agriculture markets. Video Length: 00:14:41
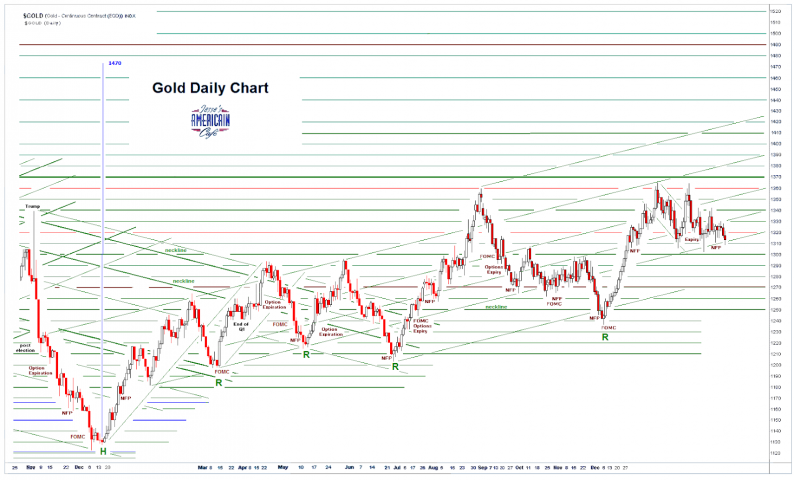
Craig Hemke joins me to look ahead to next week’s Fed meeting and most likely rate hike. 4 of the last 5 times the rate hike has put a bottom in the gold price and resulted in a nice rally.
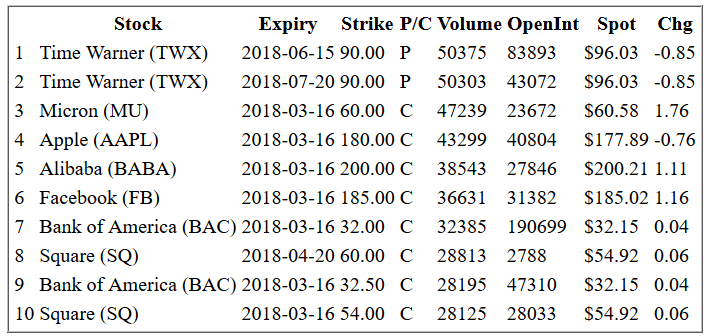
Top tickers for end of day: TWX, MU, AAPL, BABA, FB, BAC, SQ.
Bitcoin grabbed the vast majority of cryptocurrency headlines in 2017. And when bitcoin, the original cryptocurrency, passed the $10,000 mark last year, something seemed to change in the minds of mainstream investors. Suddenly, bitcoin had arrived and deserved attention. CNBC

The Investor’s Intelligence Newsletter Writers Sentiment Survey shows this week’s percentage of bullish advisors close to the 55% threshold. When the percentage gets above this level, the bullish sentiment works against stock prices. (This is an excellent sentiment survey, and

Market (SPY) valuations remain elevated by most metrics – trading at levels not seen very often historically – at least judging by its PE and Shiller CAPE ratios. What actually happens going forward (will it keep going up, drop significantly, or go sideways?)
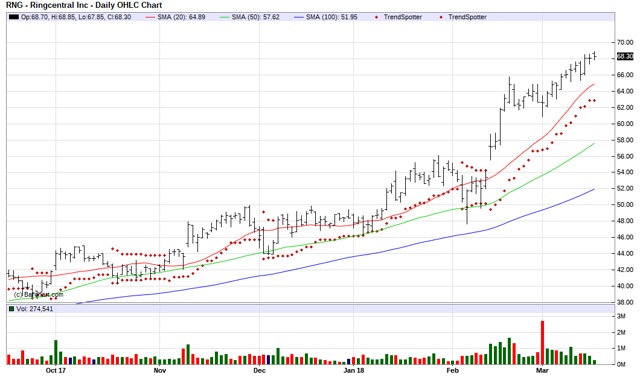
The Chart of the Day belongs to RingCentral (RNG). I found the business communications software stock by using Barchart to sort today’s New 52 Week High list first by the highest Weighted Alpha, then I used the Flipchart feature to review the charts for consistent price
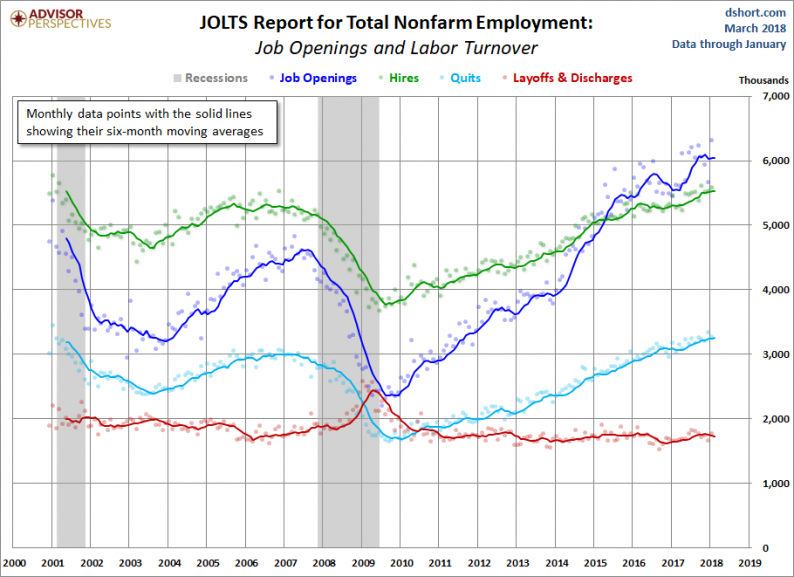
The latest JOLTS report (Job Openings and Labor Turnover Summary), with data through January, is now available. The first chart below shows four of the headline components of the overall series, which the BLS began tracking in December 2000. The time frame