
After two successive weeks of gains, the S&P 500 Index (SPX) started the week on a positive note. This suggests a risk-on sentiment which is a bullish sign. The volatility is likely to pick up as 11% of the S&P 500 companies are expected to report results this week.
The risk-on sentiment could boost buying interest in select cryptocurrencies. One area where bullish activity is seen is the Grayscale Bitcoin Trust (GBTC). Grayscale’s legal victories have reduced the discount on the GBTC to its lowest level since 2021. This indicates that the investors are factoring in the possibility that the trust will finally convert into a spot Bitcoin (BTC) ETF.
What are the important overhead resistance levels on Bitcoin and altcoins that need to be crossed to start an uptrend? Let’s analyze the charts to find out.
S&P 500 Index price analysis
The S&P 500 Index (SPX) turned down from the 50-day simple moving average (4,401) on Oct. 12, but the bears could not sink the price below the important level at 4,325.

Buyers will try to thrust the price above the overhead resistance zone between the 50-day SMA and the downtrend line. If this zone is surmounted, the index will signal the end of the corrective phase.
Conversely, if the price turns down and breaks below 4,325, it will indicate that bears are fiercely defending the 50-day SMA. The index may then retest the pivotal support at 4,216.
U.S. dollar index price analysis
The U.S. dollar index (DXY) corrected from 107.34 on Oct. 3 and dipped to the 20-day EMA ($106) on Oct. 10. In an uptrend, traders generally buy the dips to the 20-day EMA.
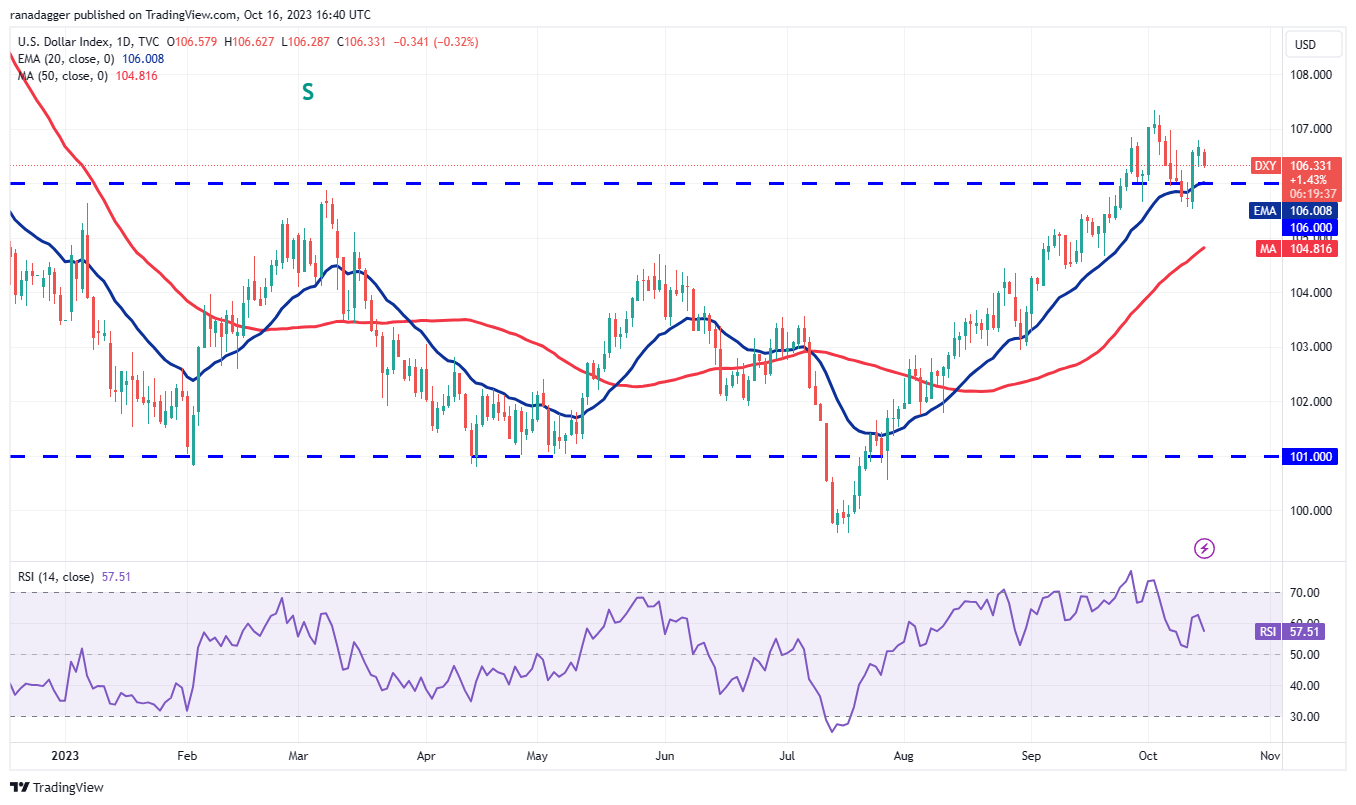
However, the bears are unlikely to give up easily. They will try to guard the overhead zone and tug the price below 105.50. If this support cracks, the index may dip to the 50-day SMA ($104.81). This is an important level for the bulls to defend if they want to keep the up-move intact. Below this level, the index could fall to 103.
Bitcoin price analysis
After trading between the moving averages for the past few days, Bitcoin made a decisive move on Oct. 16 when bulls kicked the price above the 20-day EMA ($27,224).
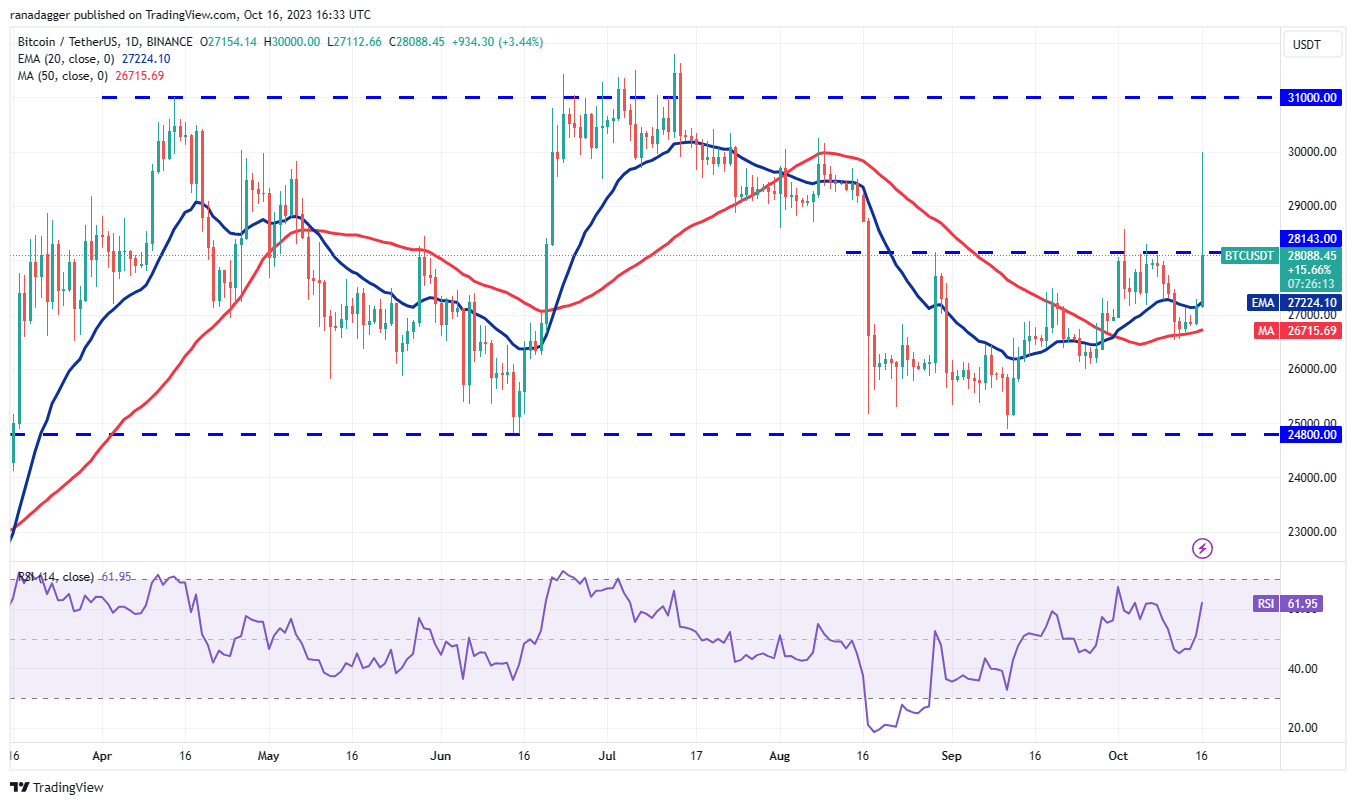
The 20-day EMA has started to turn up and the RSI has jumped into positive territory, indicating that the bulls have a slight edge. If buyers achieve a close above $28,143, the pair may march toward $30,000 and then to $31,000.
On the downside, a break and close below the 50-day SMA ($26,715) will tilt the advantage in favor of the bears. The pair may first plummet to $26,000 and then to $24,800.
Ether price analysis
Ether (ETH) has been oscillating between $1,531 and $1,746 for the past several days. Generally, in a range, traders buy near the support and sell at the resistance.
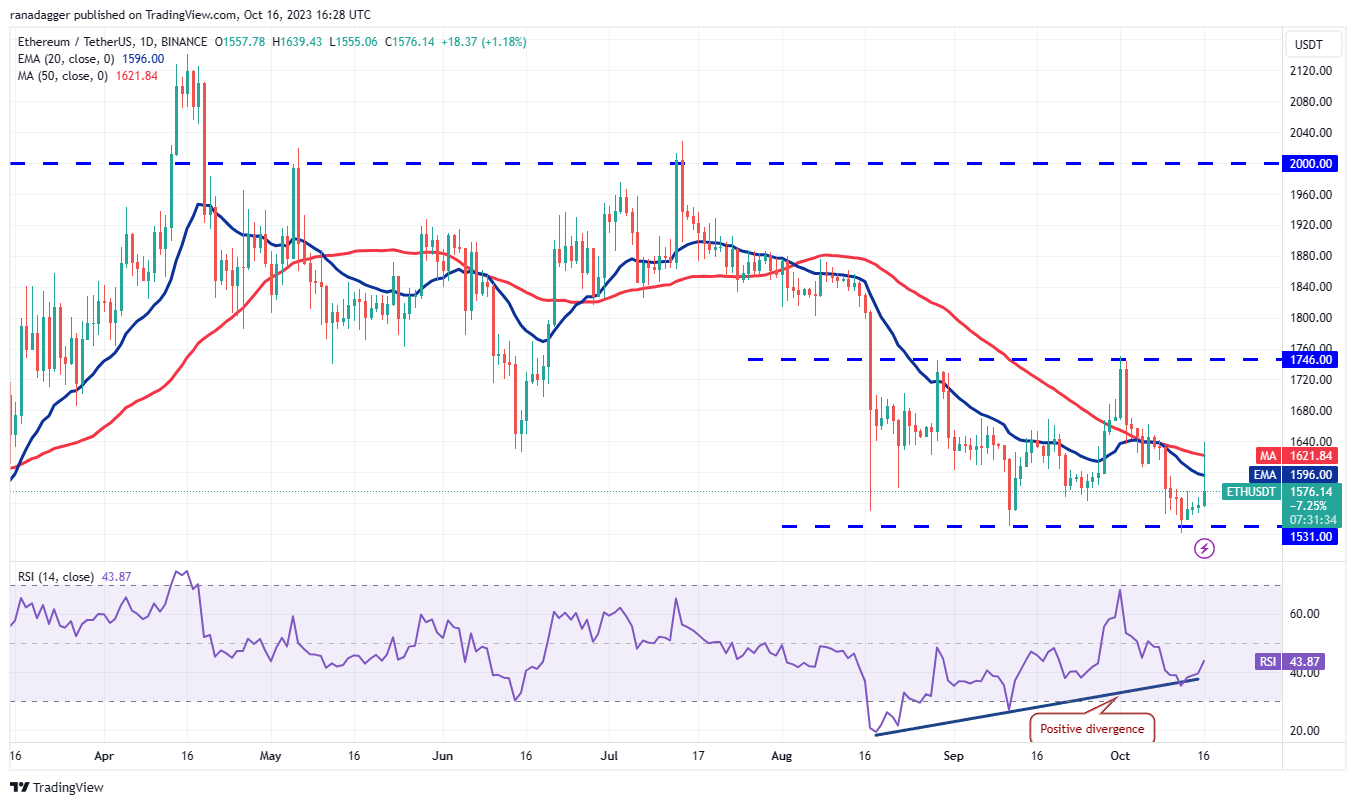
If the price turns down from the current level, the bears will make one more attempt to sink and sustain the price below $1,521. If they succeed, the ETH/USDT pair may collapse to $1,368.
Contrarily, the bulls will again attempt to push and sustain the price above the moving averages. If they can pull it off, the pair could jump to $1,746. This level is again likely to witness strong selling by the bears.
BNB price analysis
BNB (BNB) rebounded off the strong support at $203 and nudged above the downtrend line on Oct. 16. However, the long wick on the candlestick shows that the bears are selling on rallies.

The bulls will again try to take advantage of this situation and propel the price above the downtrend line. If they can maintain the higher levels, it will invalidate the bearish descending triangle pattern. The BNB/USDT pair may then climb to $235 and later to $250.
This bullish view will be negated if the price turns down and plunges below the vital support at $203. The pair may then tumble to $183.
XRP price analysis
XRP (XRP) has been stuck inside the large range between $0.41 and $0.56 for the past several days. The bulls are trying to start a pullback, which is likely to face stiff resistance at the moving averages.
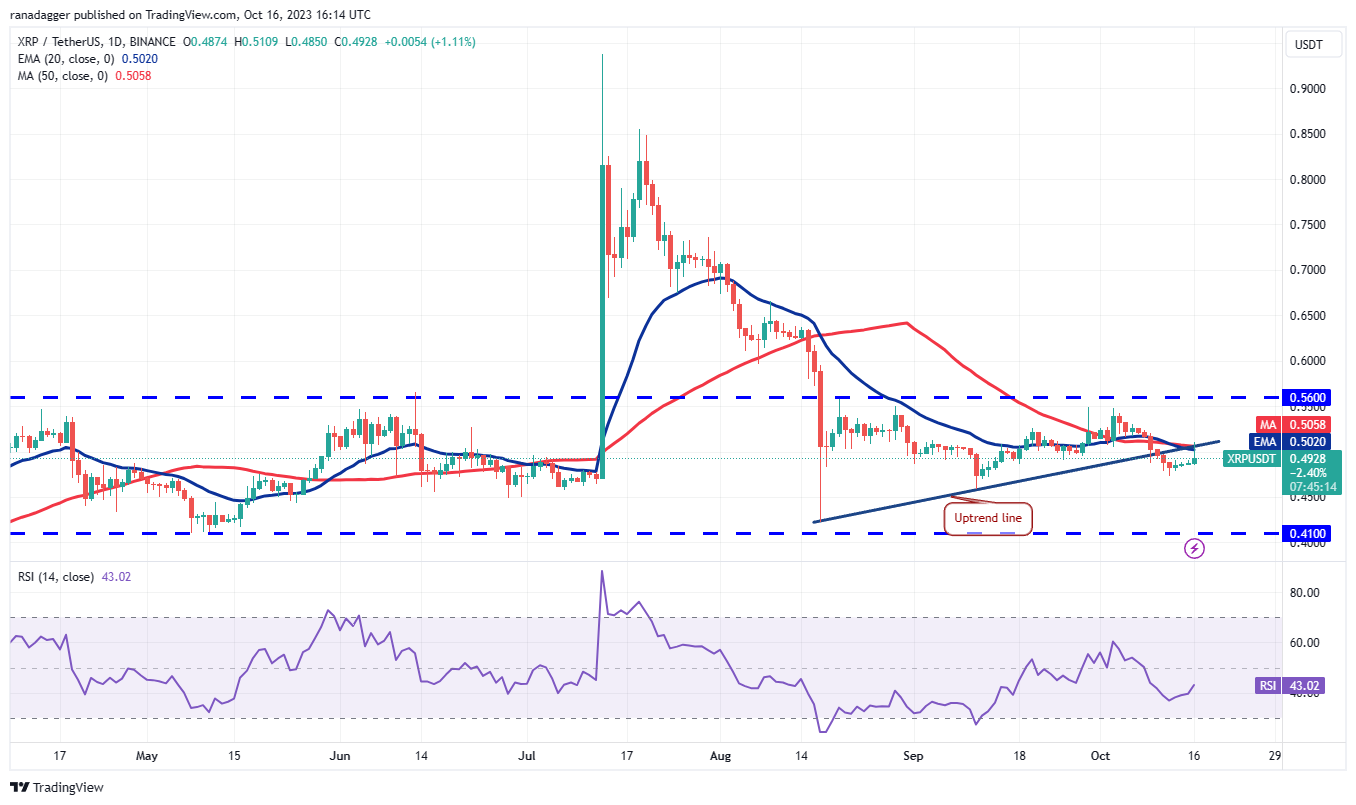
Contrarily, if bulls thrust the price above the moving averages, it will indicate solid buying at lower levels. The pair will then attempt a rally to $0.56. The bears are expected to protect this level with vigor.
Solana price analysis
Solana (SOL) surged above the near-term resistance of $22.50 on Oct. 16, indicating that the bulls are trying to take control.

If bears want to prevent the upside, they will have to quickly drag the price back below the 50-day SMA ($20.56). The pair may then dip to $18.50.
Related: Mining BTC is harder than ever — 5 things to know in Bitcoin this week
Cardano price analysis
Cardano (ADA) bounced off the strong support near $0.24, indicating that the bulls are fiercely defending this level.
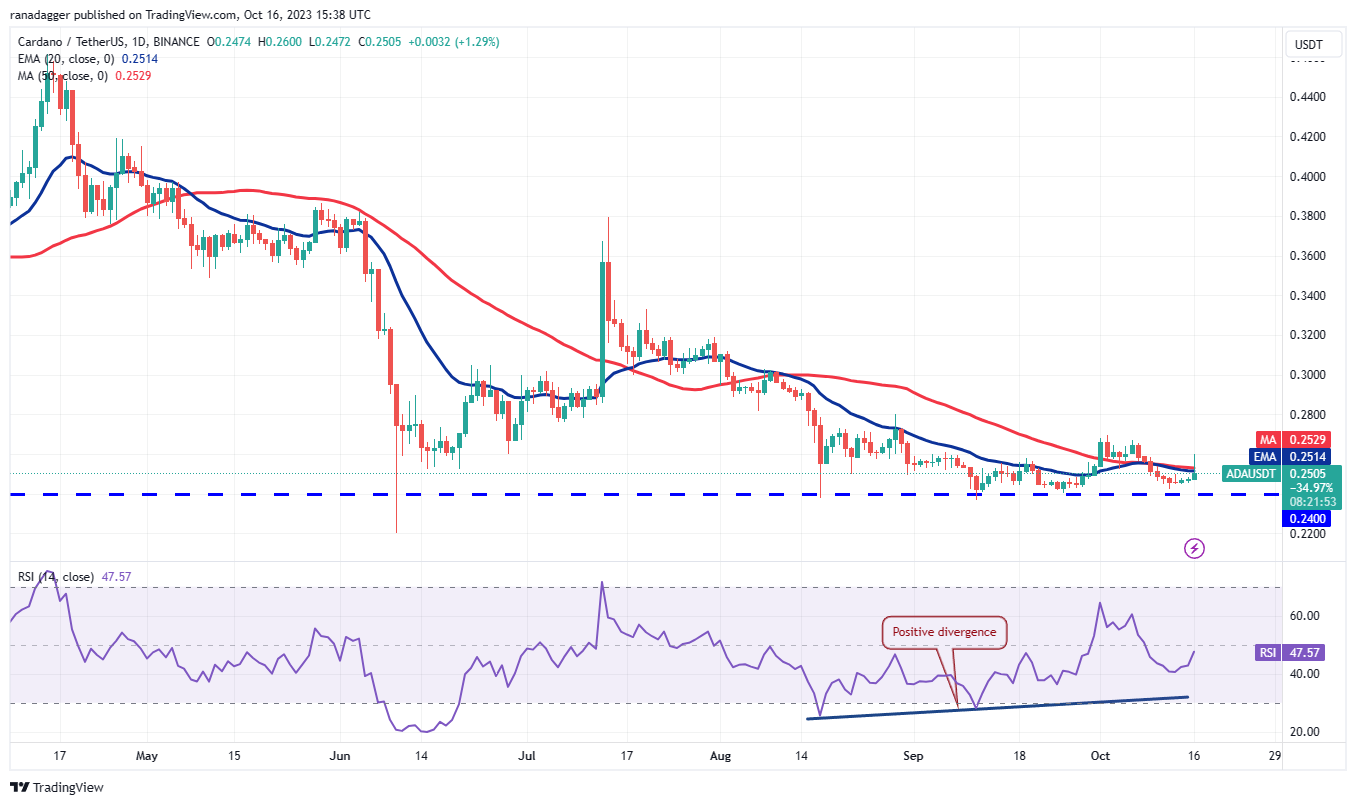
The important level to watch on the downside is $0.24. If the price turns down from the moving averages, it will increase the likelihood of a drop below $0.24. A break below this crucial support could sink the pair to $0.22 and subsequently to $0.20.
Dogecoin price analysis
Dogecoin (DOGE) recovered to the breakdown level of $0.06 on Oct. 14, indicating that lower levels are attracting buyers.

Alternatively, if the price turns down from the current level, it will suggest that the pair may extend its stay inside the $0.055 to $0.06 range for some more time.
Toncoin price analysis
Toncoin (TON) has been trading below the moving averages since October 12 but a positive sign is that the bears have not been able to capitalize on this weakness. This indicates a lack of selling at lower levels.
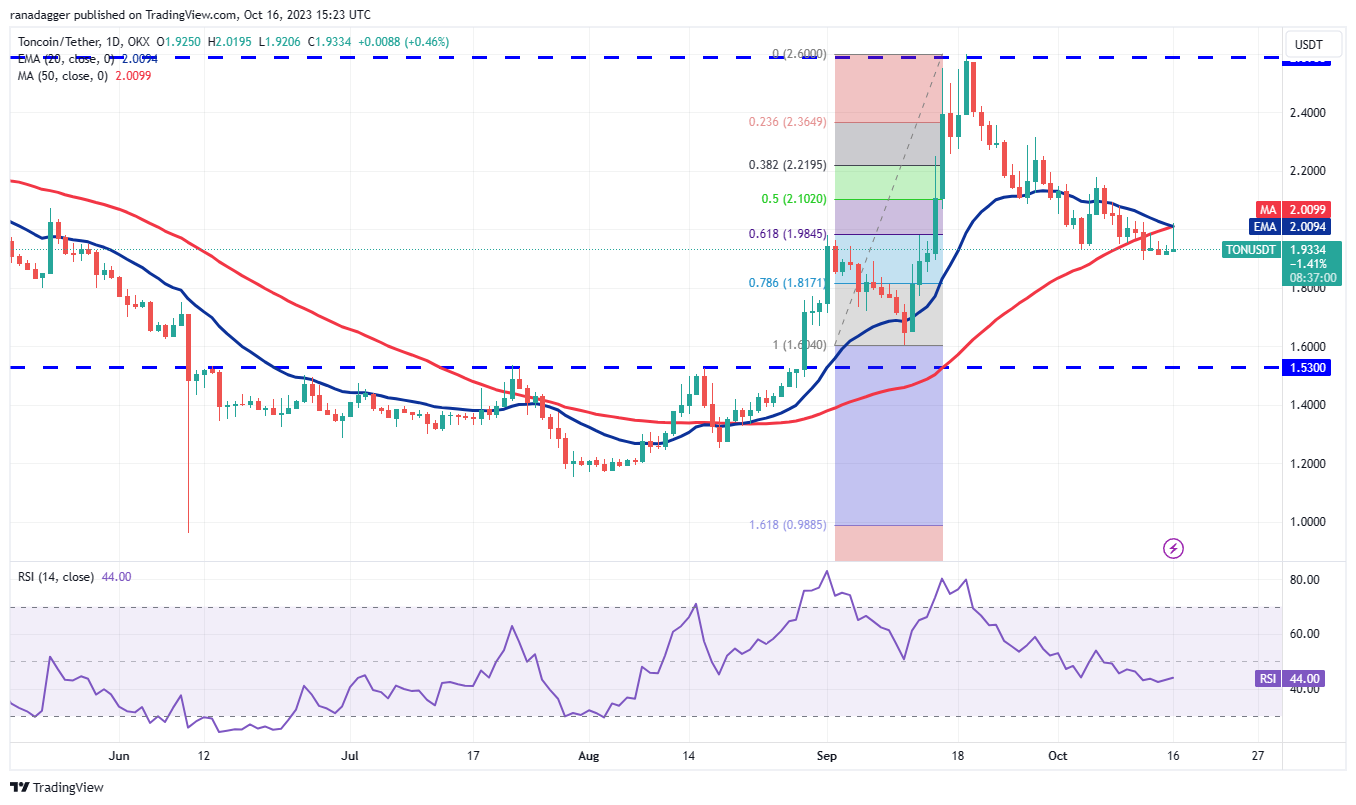
If bulls want to signal a comeback, they will have to push and sustain the price above the moving averages. The TON/USDT pair could first rise to $2.20 and then to $2.31.

Leave A Comment