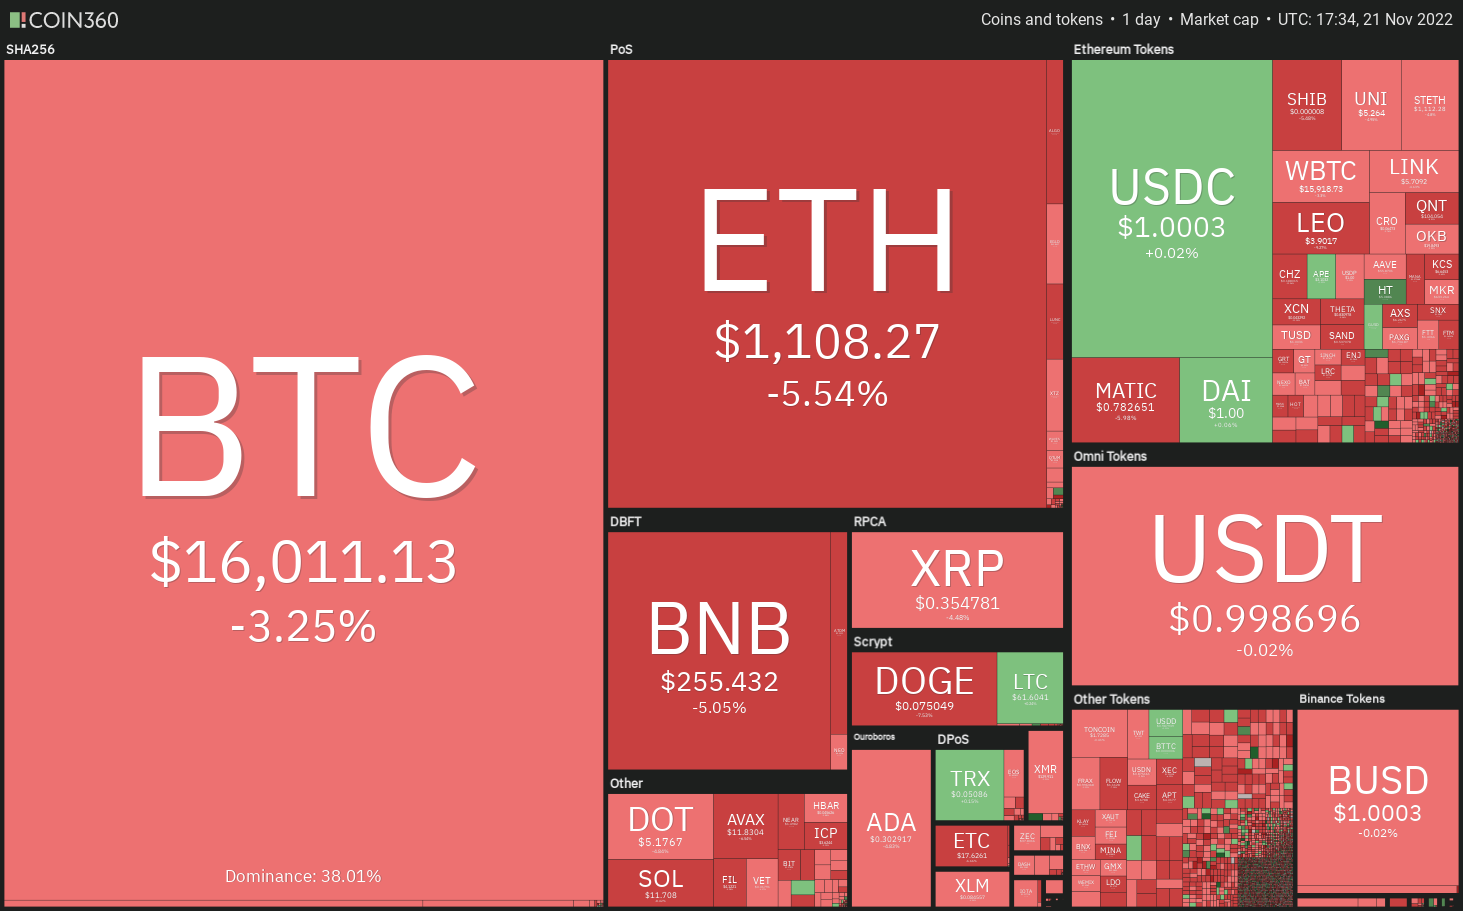
Continued selling in the cryptocurrency markets pulled the total market capitalization below $800 billion on Nov. 21. Traders are increasingly nervous about the extent of damage FTX’s collapse may have on several crypto firms. Until the uncertainty clears, it is futile to expect a sustained recovery in cryptocurrency prices.
The FTX saga has broken the close correlation between the United States equities markets and Bitcoin (BTC). While Bitcoin is trading close to its 52-week low, the S&P 500 (SPX) has recovered sharply from its low made on Oct. 13.
However, Billionaire investor and hedge fund manager Bill Ackman said in a Twitter thread on Nov. 20 that crypto was “here to stay with proper oversight and regulation.”He also highlighted the potential of cryptocurrencies to “greatly benefit society and grow the global economy.”
Could the cryptocurrency market catch up with the U.S. stock markets? Let’s study the charts of the S&P 500 index, the U.S. dollar index (DXY) and the major cryptocurrencies to find out.
SPX
The S&P 500 index has been in a strong recovery since bottoming out at 3,491 on Oct. 13. Although the 4,000 level has been acting as a resistance in the past few days, a positive sign is that the bulls have not given up much ground.
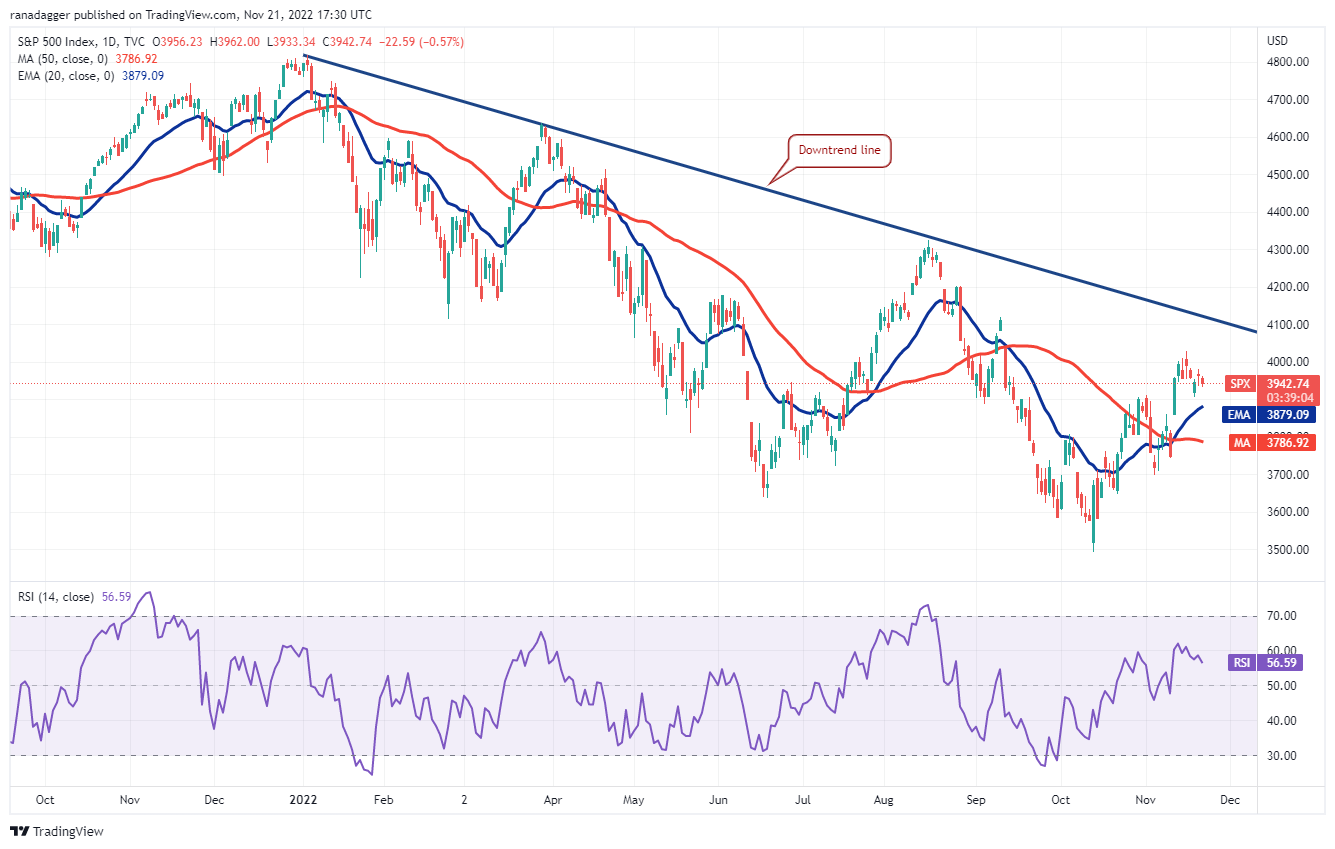
The bears have successfully halted previous relief rallies near the downtrend line hence they will try to do the same again.
If the price turns down from the downtrend line but does not slip below the 20-day EMA, it will suggest that bulls are buying on dips. That could increase the likelihood of a break above the downtrend line.
The first sign of weakness will be a break and close below the 20-day EMA. The index could then decline to the 50-day simple moving average (3,786).
DXY
The U.S. dollar index plunged below the uptrend line on Nov. 10. This is the first indication that the index may have topped out in the near term.
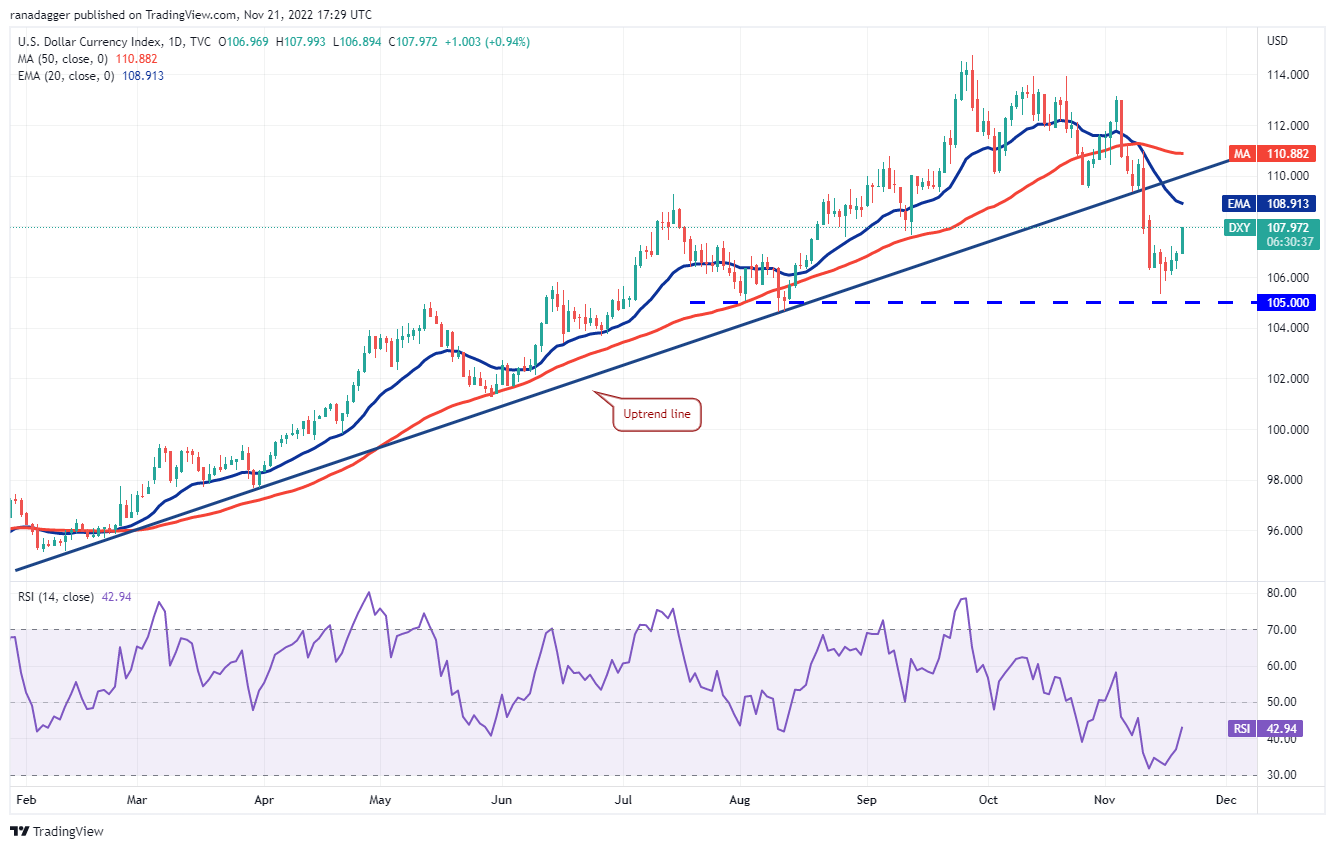
If the relief rally stalls near the 20-day EMA, the bears will make another attempt to pull the index below 105. If they succeed, the next stop could be 103.50 and then 102.
Alternatively, if buyers drive the price above the 20-day EMA, the index could rise to the uptrend line. The bulls will have to push the price back above this level to indicate that the corrective phase may be over.
BTC/USDT
Bitcoin remains in a downtrend. The bears pulled the price below the immediate support of $16,229 on Nov. 21, which suggests a lack of demand from the bulls.
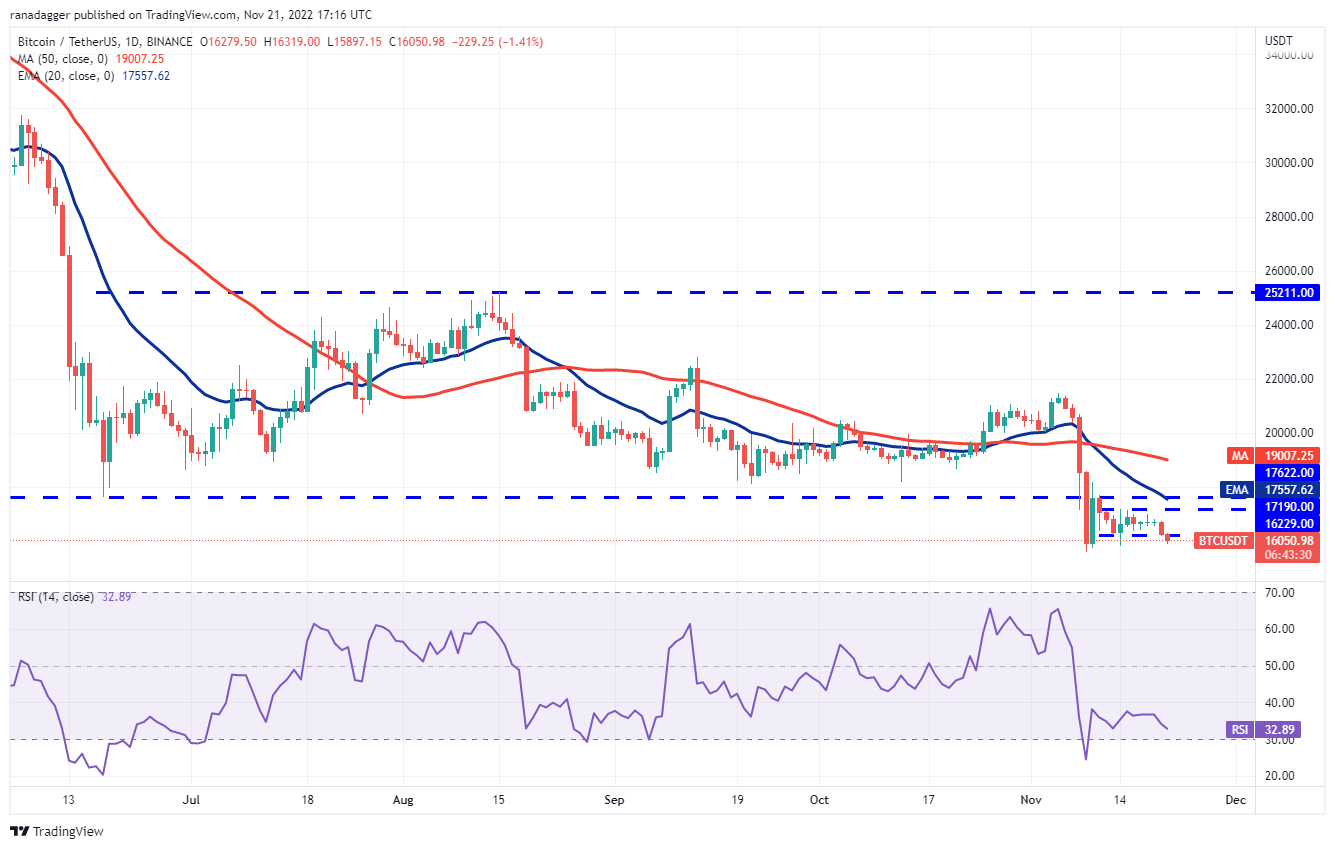
On the contrary, if the price turns up and breaks back above $16,229, it will suggest that the bulls are buying the dips below $16,000. The bulls will then attempt to push the price toward the overhead resistance at $17,190.
ETH/USDT
Ether (ETH) continues to gradually slide toward the support line of the descending channel pattern. This is an important level for the bulls to defend because a break below the channel could intensify selling.
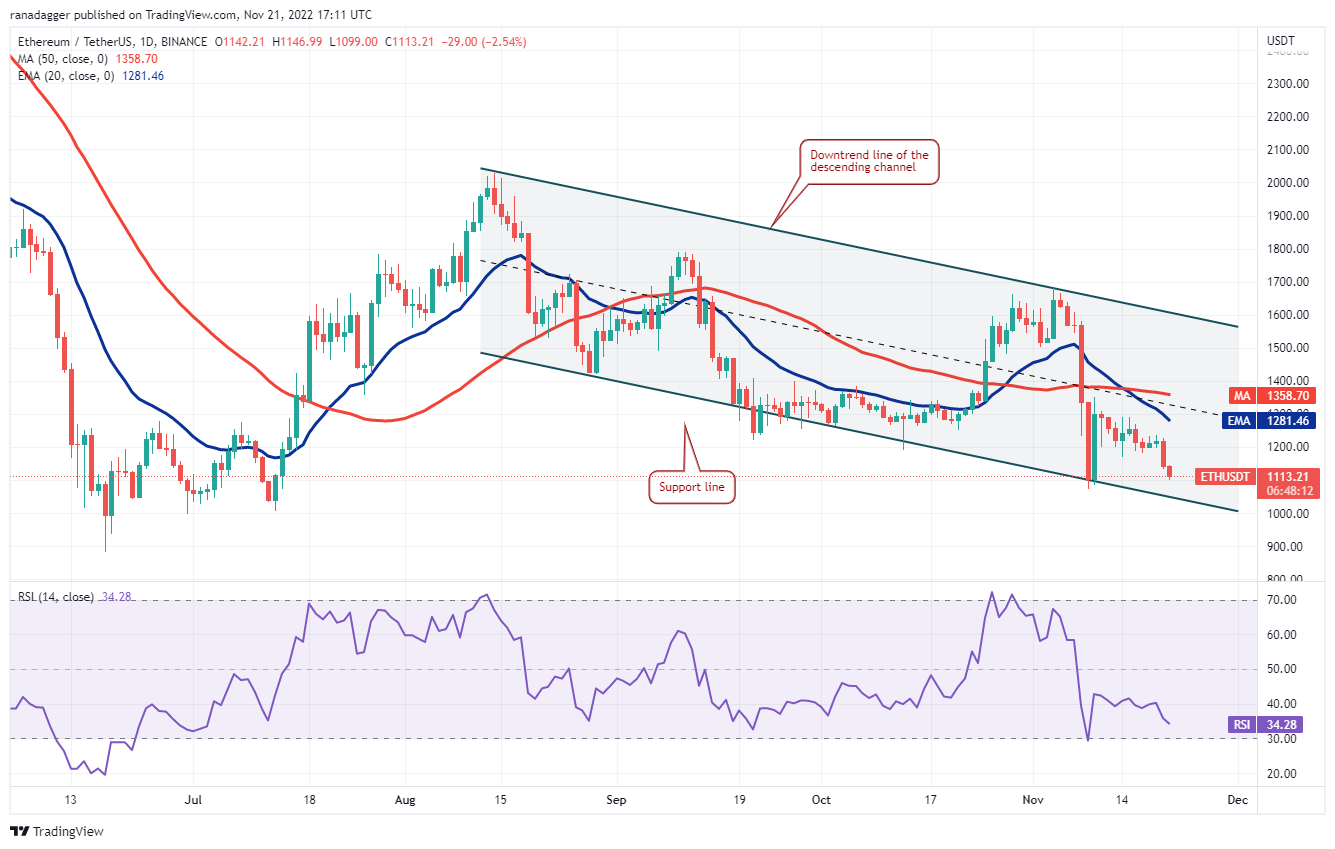
Contrary to this assumption, if the price rebounds off the support line with strength, it will suggest that buyers are defending the level with all their might. They will then try to clear the moving averages and open the doors for a possible rally to the downtrend line of the channel.
BNB/USDT
BNB (BNB) has declined to the critical support at $258 which could witness a tough battle between the bulls and the bears.
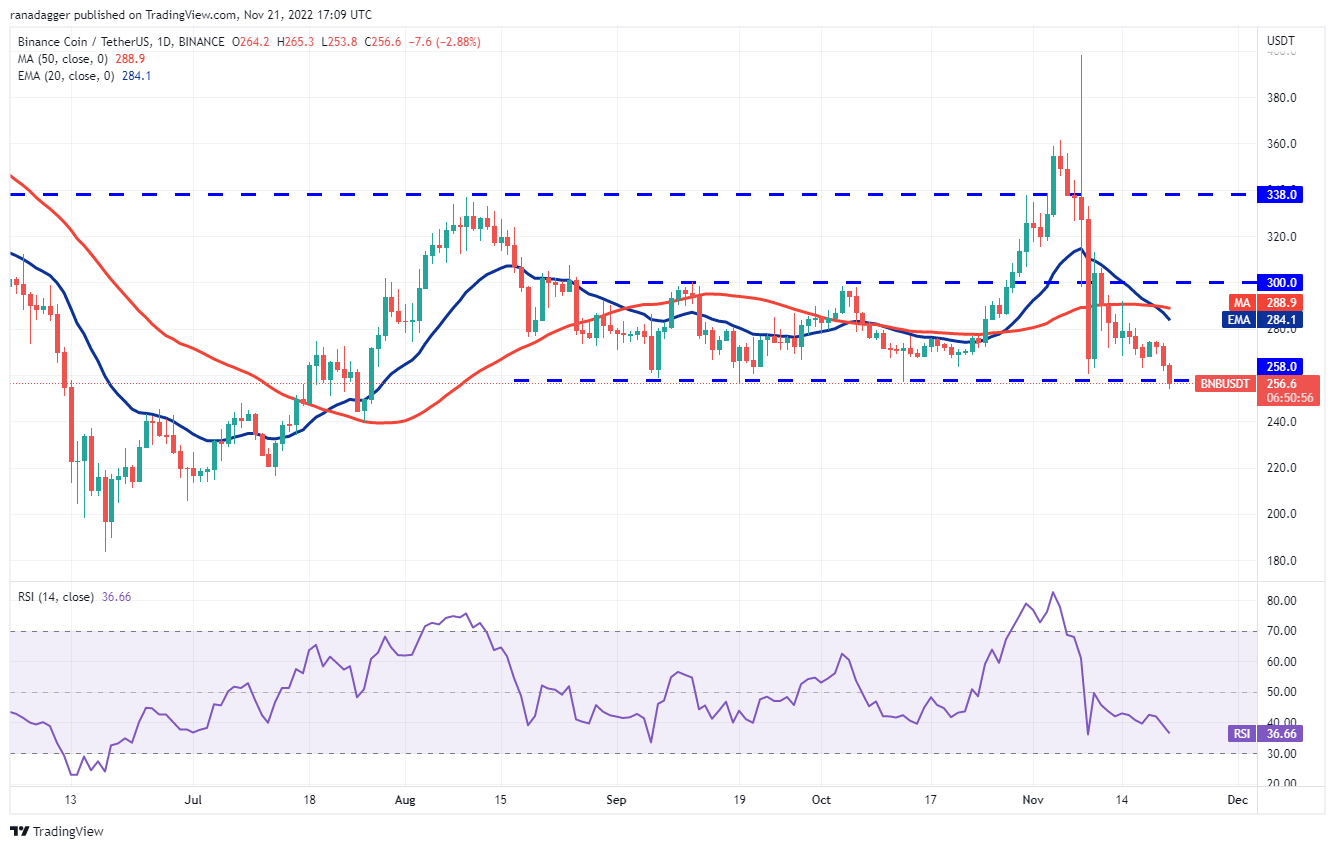
Alternatively, if the price turns up from the current level, it will suggest that the bulls continue to buy the dips to $258. The pair could then rise to the moving averages where the bears may again mount a strong defense.
XRP/USDT
Buyers pushed XRP (XRP) above the downtrend line on Nov. 20 but could not clear the hurdle at the 20-day EMA ($0.39). This suggests that the sentiment remains negative and traders are selling on rallies.
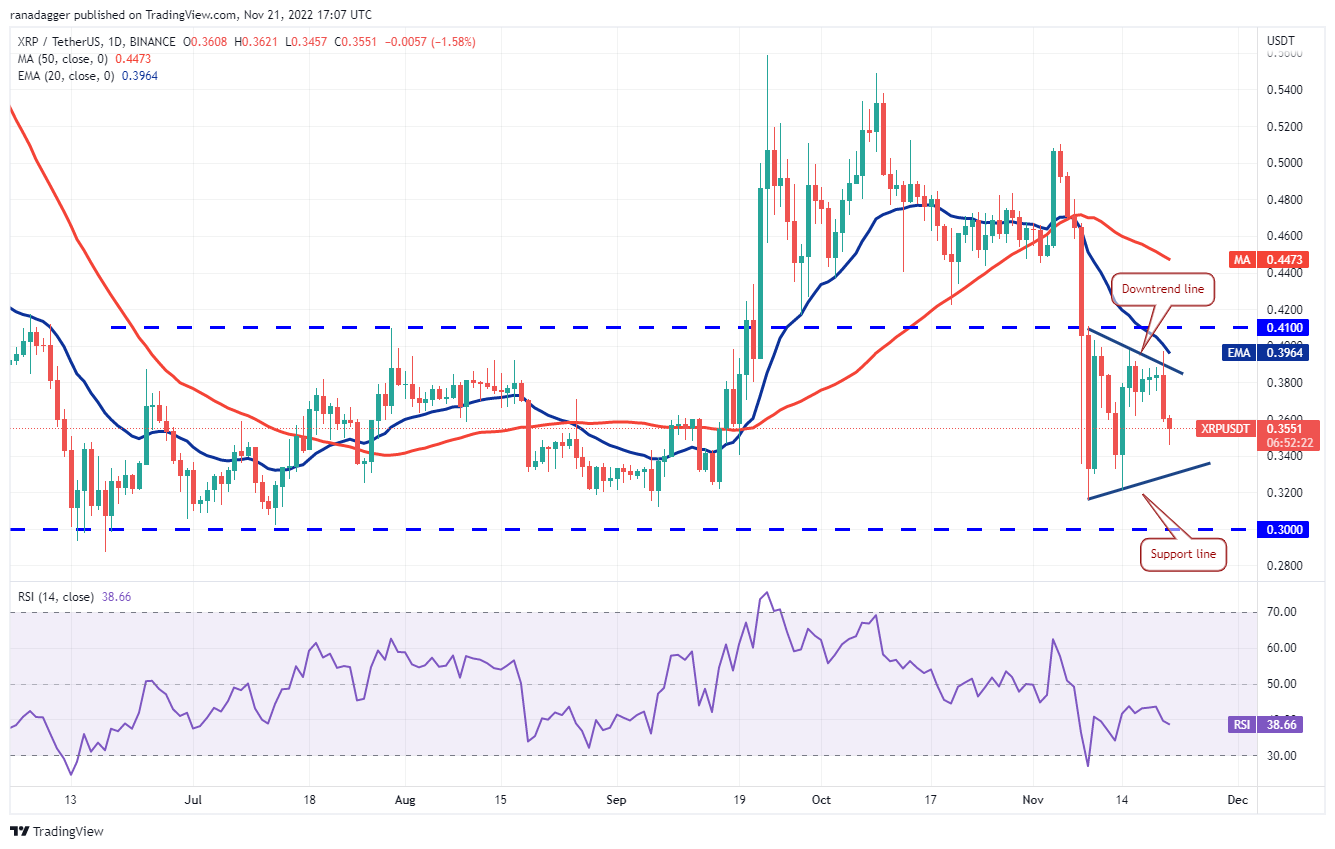
On the other hand, if the price slips below the support line, the pair could drop to the $0.32 to $0.30 support zone. A strong rebound off this zone will indicate that the pair may remain stuck between $0.30 and $0.41 for a few days.
The bears will have to pull the price below $0.30 to signal the start of the next leg of the downtrend.
ADA/USDT
Cardano (ADA) remains in a strong downtrend. The bears pulled the price below the immediate support at $0.31 on Nov. 21 opening the doors for a possible drop to the support line.
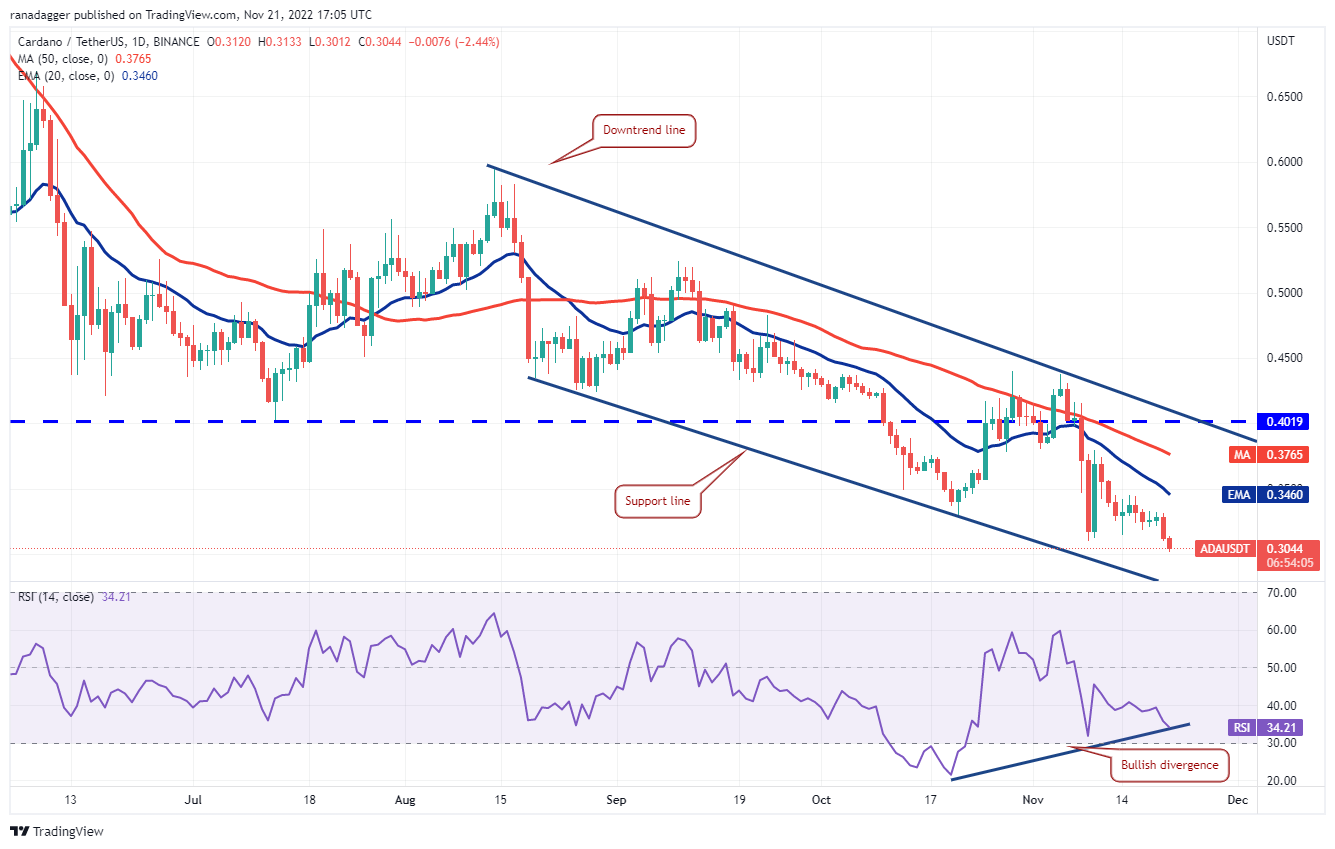
If the price turns down from this level, it will suggest that bears continue to sell on rallies. That could result in a retest of the support line. If this level cracks, the selling could accelerate and the pair may drop to $0.25. Contrarily, a break above the 20-day EMA could embolden the buyers who may push the pair to the downtrend line.
Related: Bitcoin price levels to watch as traders bet on sub-$14K BTC
DOGE/USDT
After trading between the moving averages for several days, Dogecoin (DOGE) plunged below the 50-day SMA ($0.08) on Nov. 20. This indicates that the uncertainty resolved in favor of the bears.
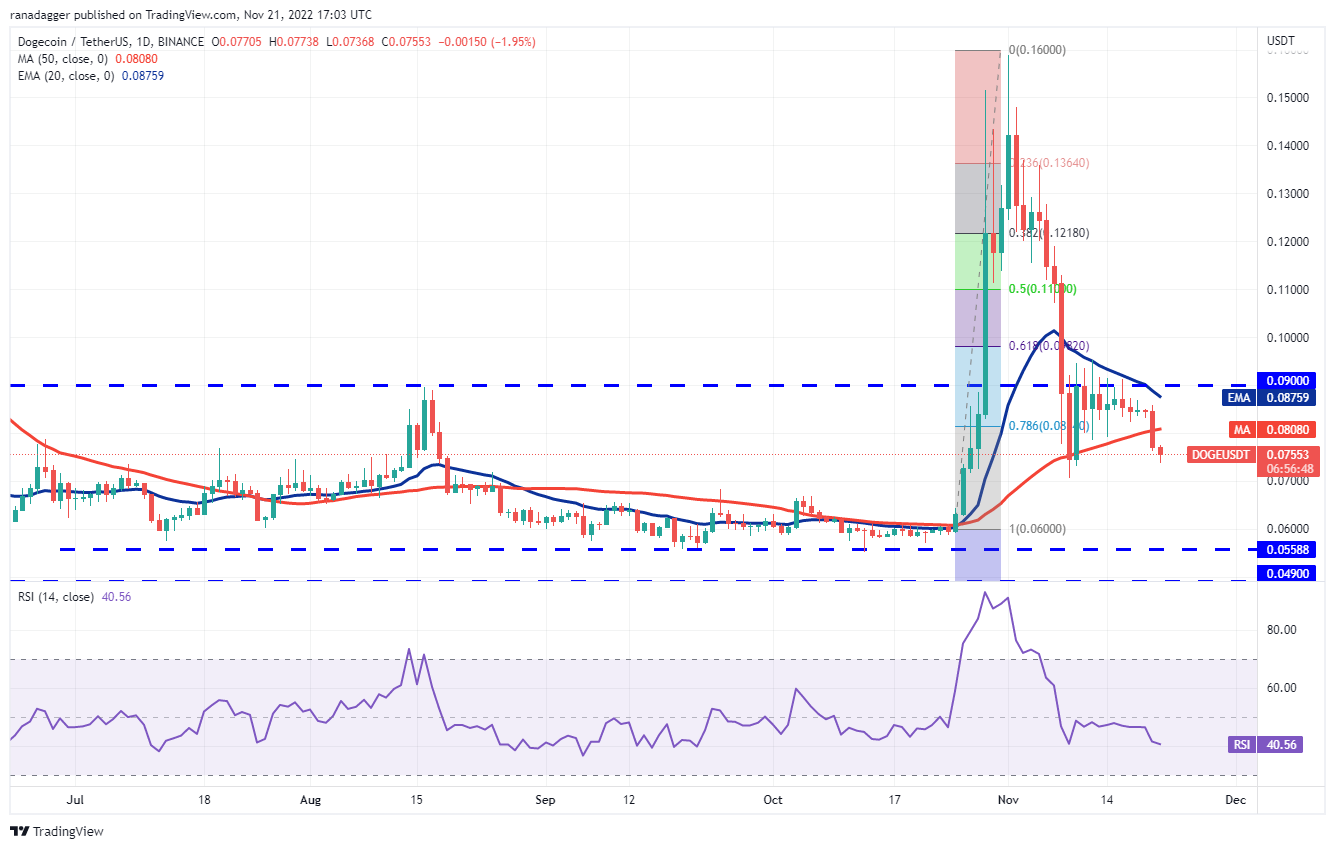
Conversely, if the price rebounds off the current level or $0.07, the bulls will again try to propel the pair above $0.09. A close above this resistance could signal that the corrective phase may be over. The pair could then rally to $0.12.
MATIC/USDT
Polygon (MATIC) dropped to the uptrend line on Nov. 21. This level has acted as a support on two previous occasions, hence the bulls will again try to defend it.
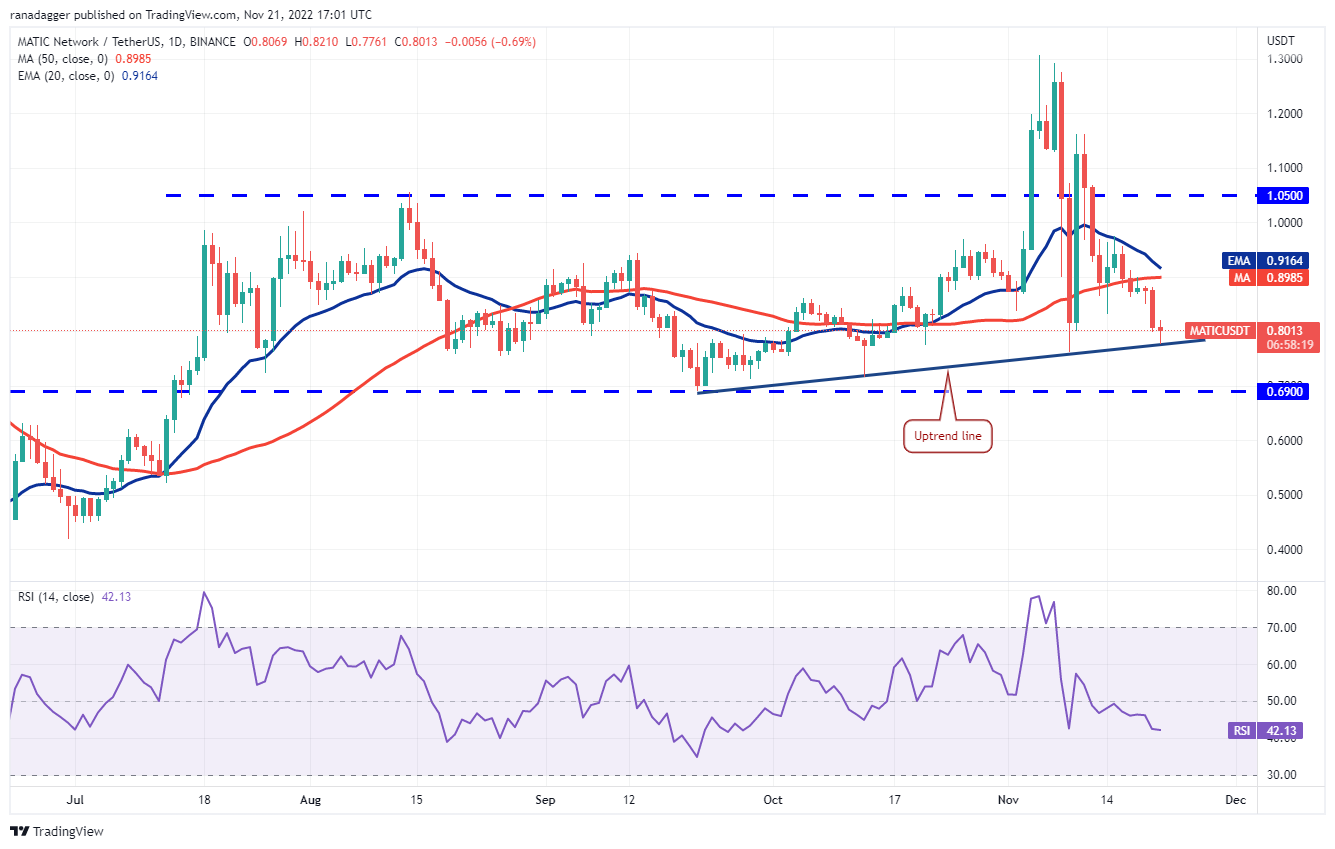
On the upside, the 20-day EMA remains the key resistance to keep an eye on. If buyers drive the price above the 20-day EMA, the pair could rise to $0.97 and later to the stiff overhead resistance at $1.05.
DOT/USDT
Polkadot (DOT) remains in a strong downtrend. The bears pulled the price below the pennant formation and the Nov. 10 intraday low of $5.32 on Nov. 20. This indicates the resumption of the downtrend.
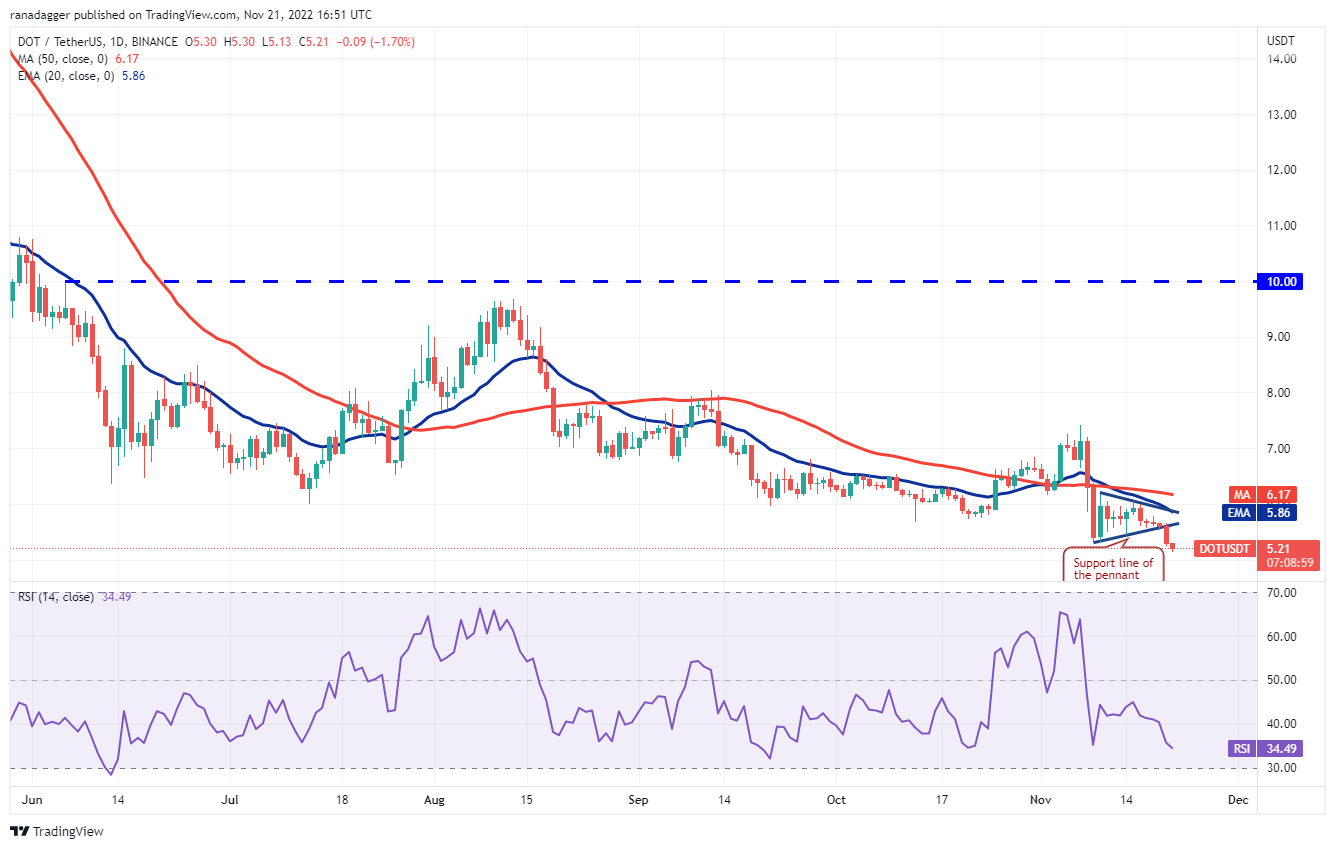
On the contrary, if buyers thrust the price above the 20-day EMA ($5.86), it will indicate aggressive buying at lower levels. That may trigger short covering from the aggressive bulls, clearing the path for a possible rally to $6.50.
The views, thoughts and opinions expressed here are the authors’ alone and do not necessarily reflect or represent the views and opinions of Cointelegraph.

Leave A Comment