
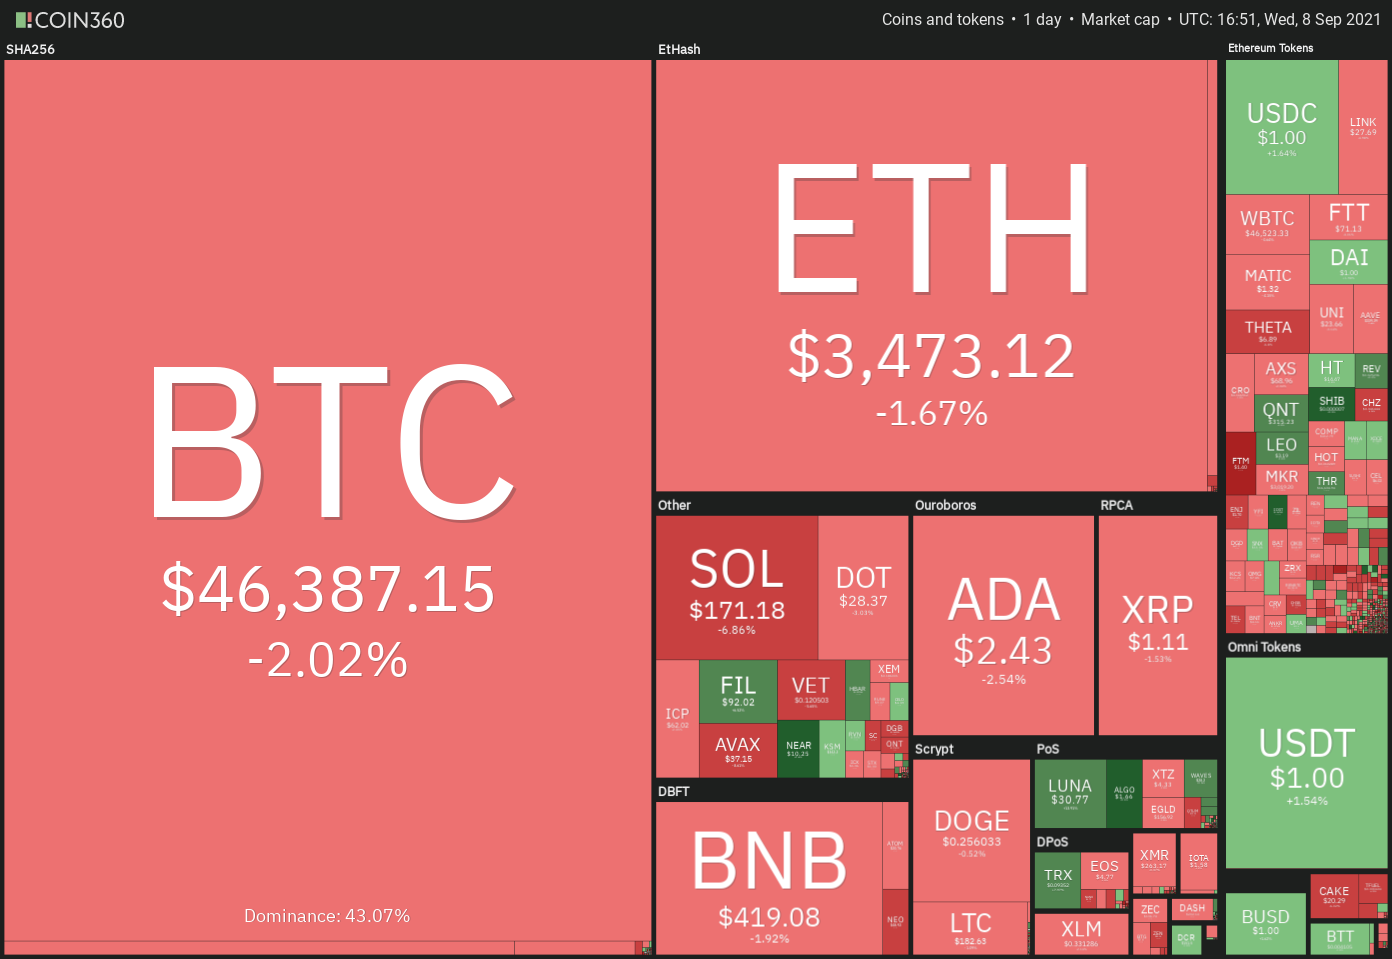
Analysts are attributing Bitcoin’s (BTC) plunge on Sep. 7 to the liquidation of over-leveraged positions. According to Bybt data, about $3.68 billion worth of long positions were liquidated in the last 24 hours in the Bitcoin options market.
On-chain monitoring resource Whalemap said the decline was largely caused due to selling by whales who had recently bought their Bitcoin and not by the HODLers. Separately, analyst Willy Woo also said:
“Leverage markets sold off but investor buying just got stronger.”
Every bull market has its share of corrections where weaker hands are shaken out and the stronger hands solidify their position. Therefore, if investors believe in the long-term story, they should not be perturbed by the pullbacks.
Is the correction in Bitcoin and altcoins over or could there be another leg down? Let’s study the charts of the top-10 cryptocurrencies to find out.
BTC/USDT
Bitcoin witnessed huge volatility on Sep. 7 when it plunged from an intraday high at $52,920 to an intraday low at $42,843.05. Strong buying at lower levels resulted in a sharp recovery by the close, as seen from the long tail on the day’s candlestick.
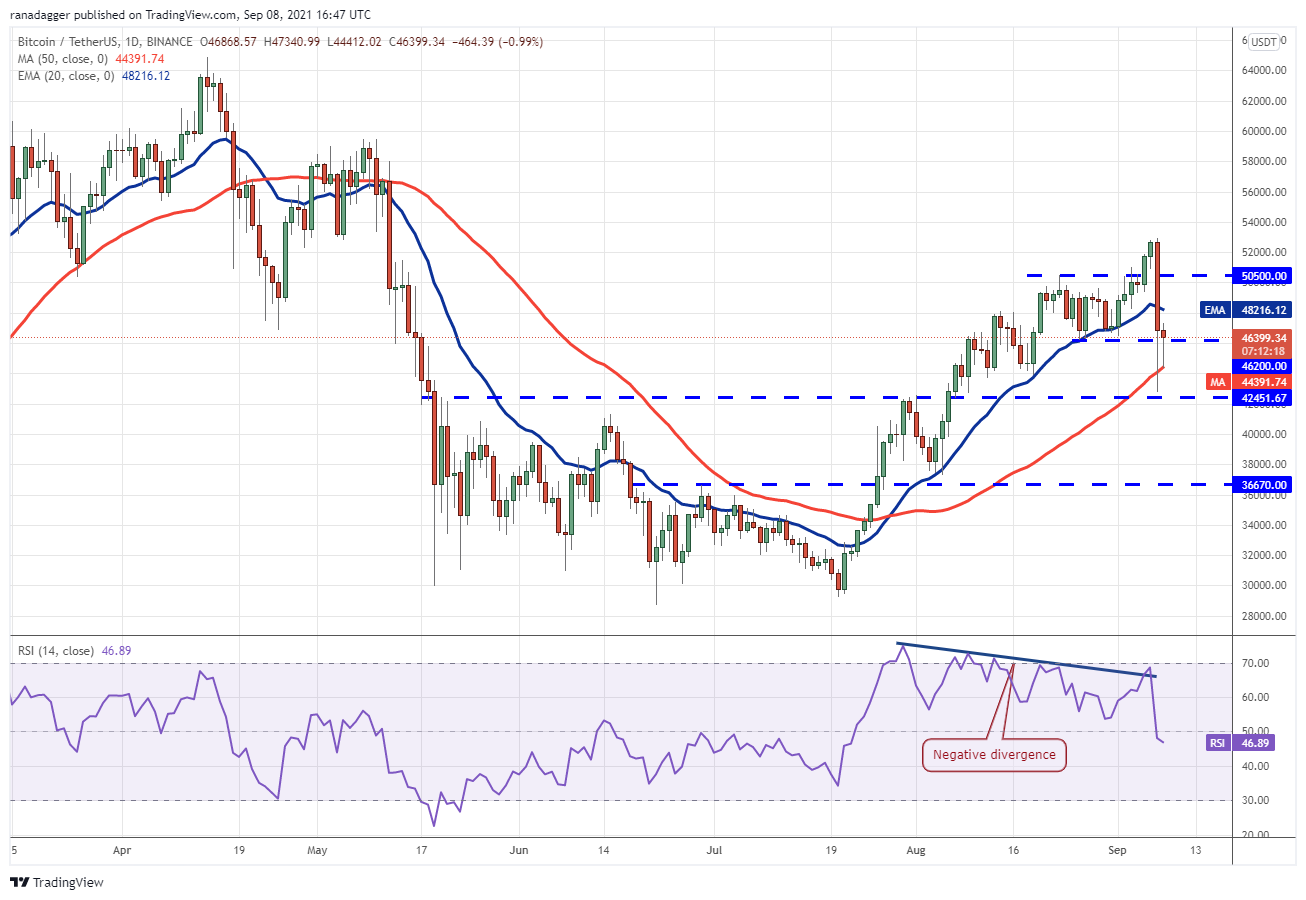
If the zone holds, the bulls will try to push the price above the 20-day exponential moving average ($48,216). If they succeed, the BTC/USDT pair could again rise to $52,920 but the bears are unlikely to give up easily.
The relative strength index (RSI) has dropped below 47 and the 20-day EMA has started to turn down, indicating that bears have made a strong comeback. If the price turns down from the 20-day EMA, the bears will again try to sink the pair below $42,451.67. If that happens, the pair could enter a deeper corrective phase.
ETH/USDT
Ether’s failure to rise and sustain above $4,000 could have attracted aggressive profit-booking from the short-term traders. The selling intensified after the price slipped below the immediate support at $3,705.05.
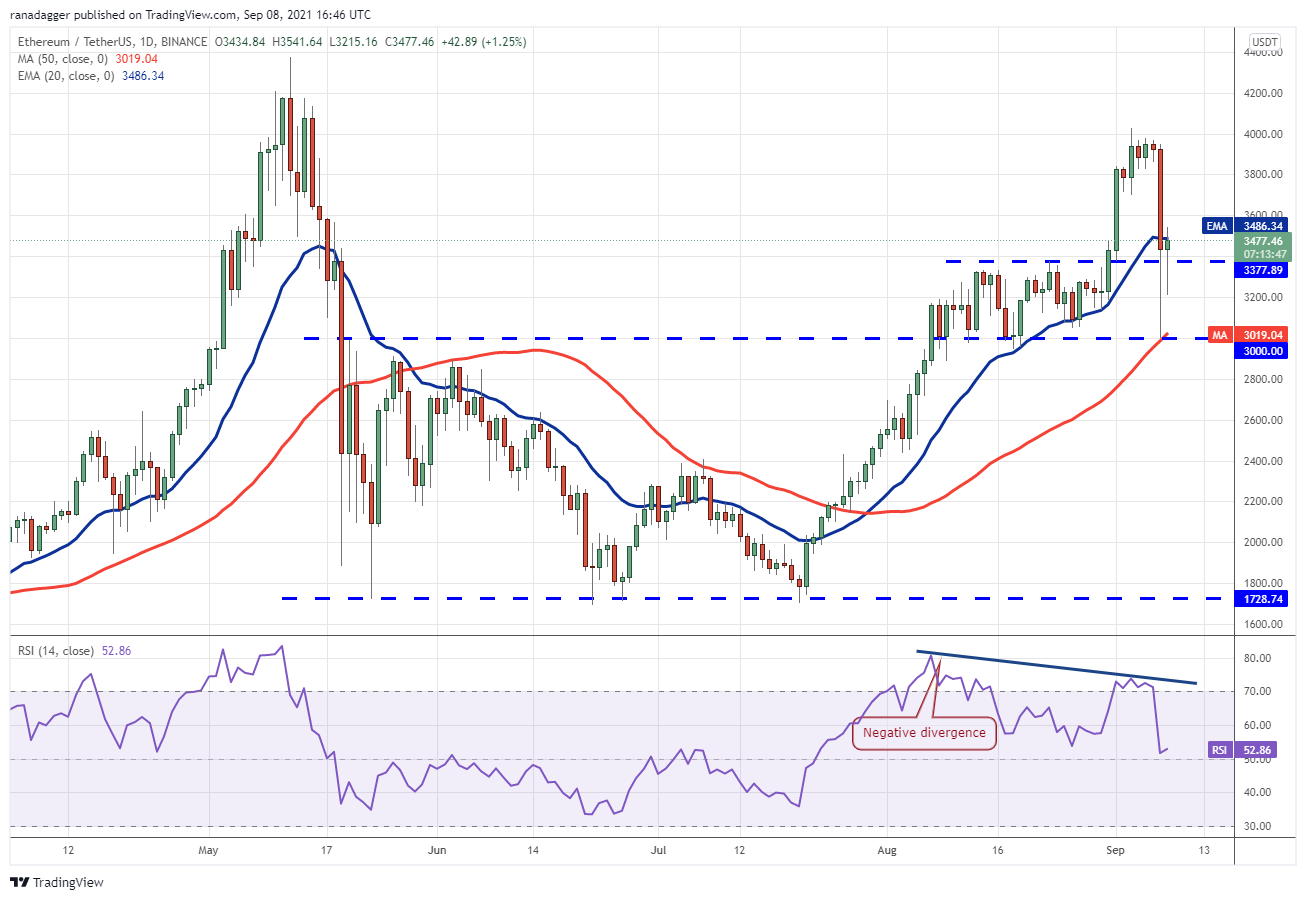
Although bulls pushed the pair above the 20-day EMA today, they have not been able to sustain the price above it. This shows that bears are selling on rallies. The flat 20-day EMA and the RSI near the midpoint, suggest a range-bound action in the next few days.
ADA/USDT
Vertical rallies are usually followed by waterfall declines as traders rush to the exit and that is what happened in Cardano (ADA) on Sep. 7. The failure to sustain the price above the psychological level at $3 may have resulted in aggressive profit-booking by the bulls.
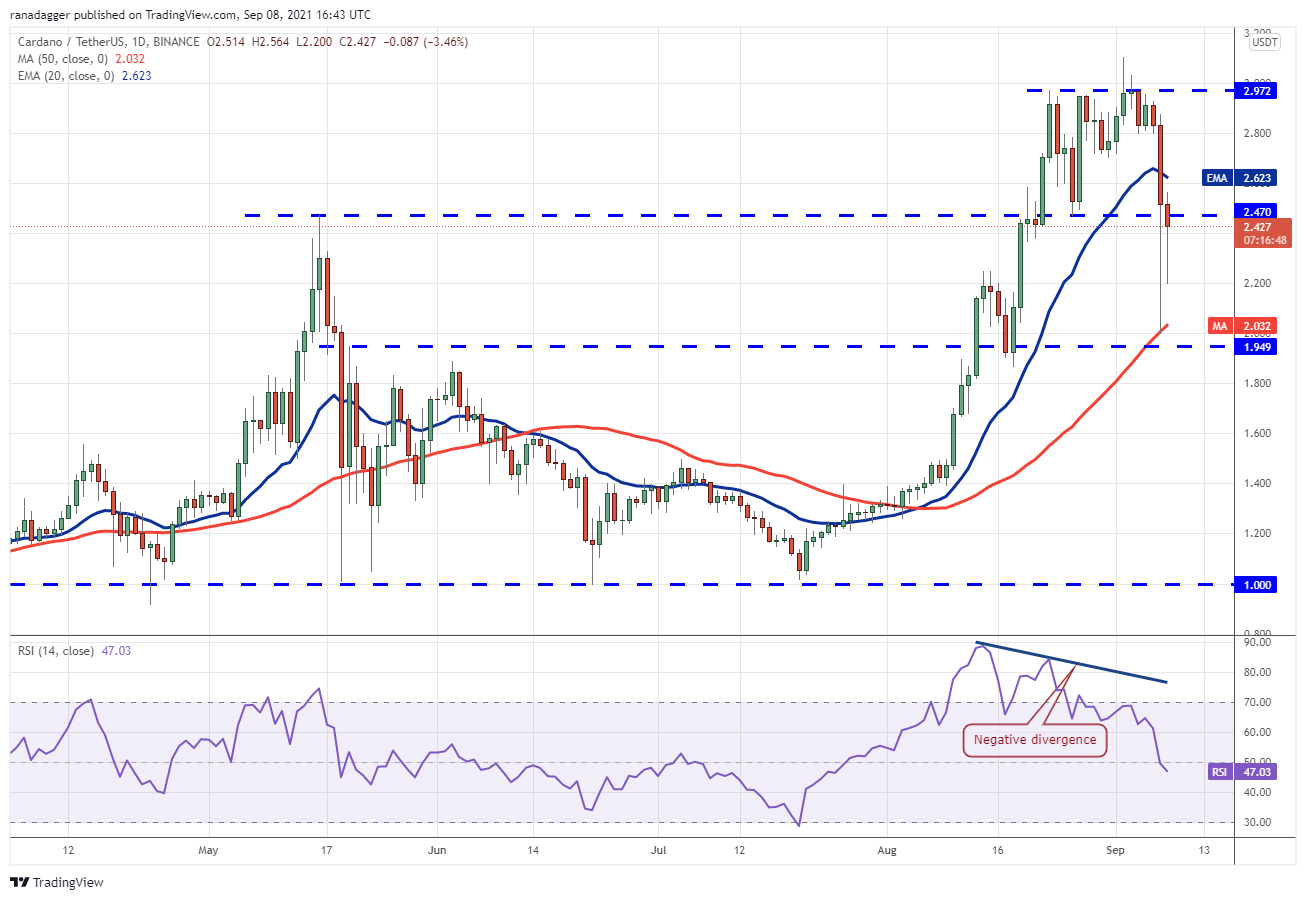
If bulls fail to push and sustain the price above the 20-day EMA, the bears are likely to make one more attempt to sink the price below the 50-day SMA. If they pull it off, it will signal a change in trend where rallies are likely to be sold into.
Alternatively, if buyers successfully defend the 50-day SMA, the pair could enter a consolidation for the next few days.
BNB/USDT
Binance Coin (BNB) turned down from the overhead resistance at $518.90 on Sep.7 and broke below the moving averages. Although bulls defended the 50-day SMA ($399) on a closing basis, the failure to push and sustain the price above $433 may attract further selling.
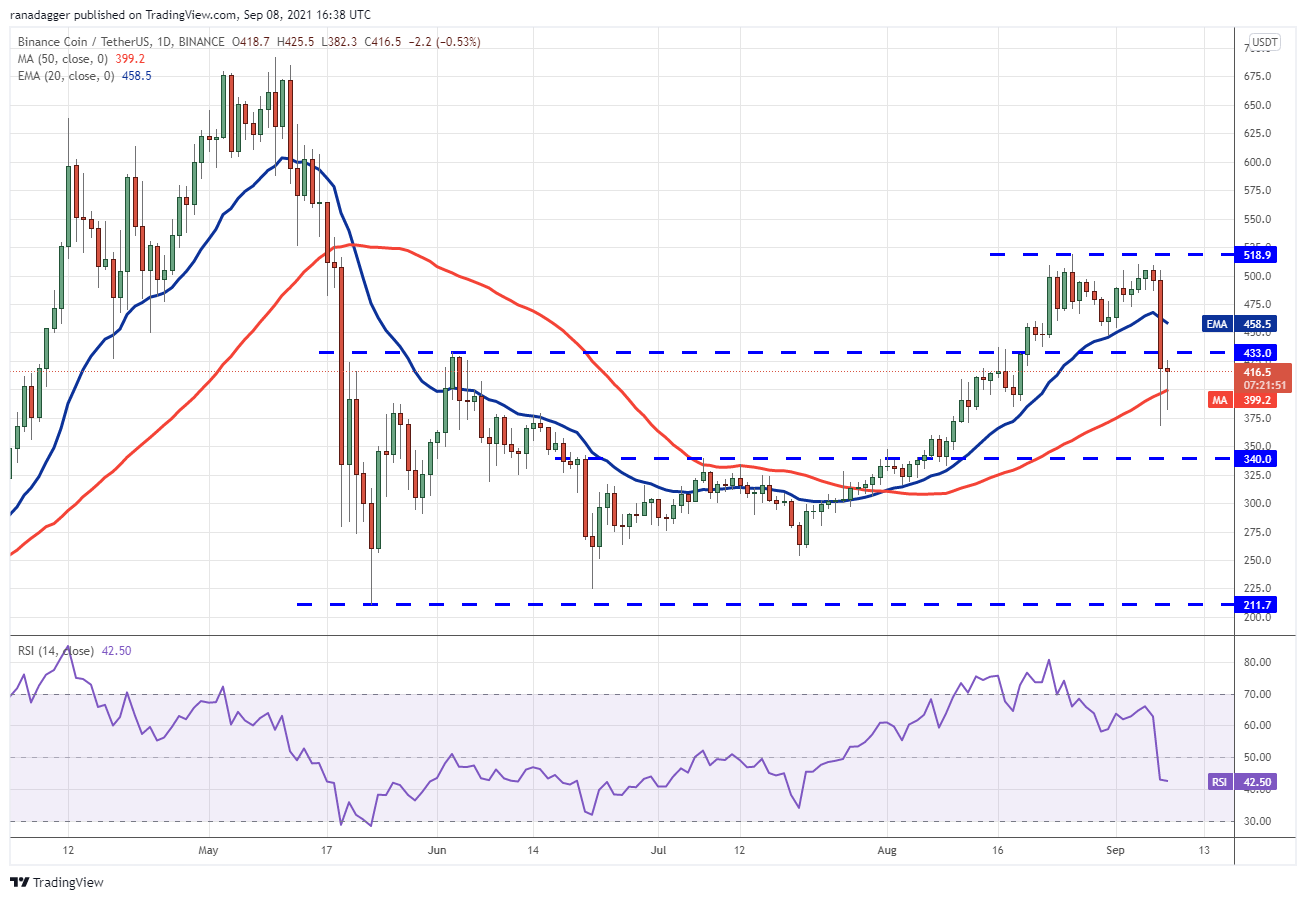
If the price turns down and breaks below the 50-day SMA, the BNB/USDT pair could drop to the next support at $340. Such a move could keep the pair range-bound between $340 and $433 for a few days.
XRP/USDT
XRP rallied and closed above the overhead resistance at $1.35 on Sep. 6 but the breakout proved to be a bull trap. The bears sold aggressively and pulled the price to the 50-day SMA ($0.98).
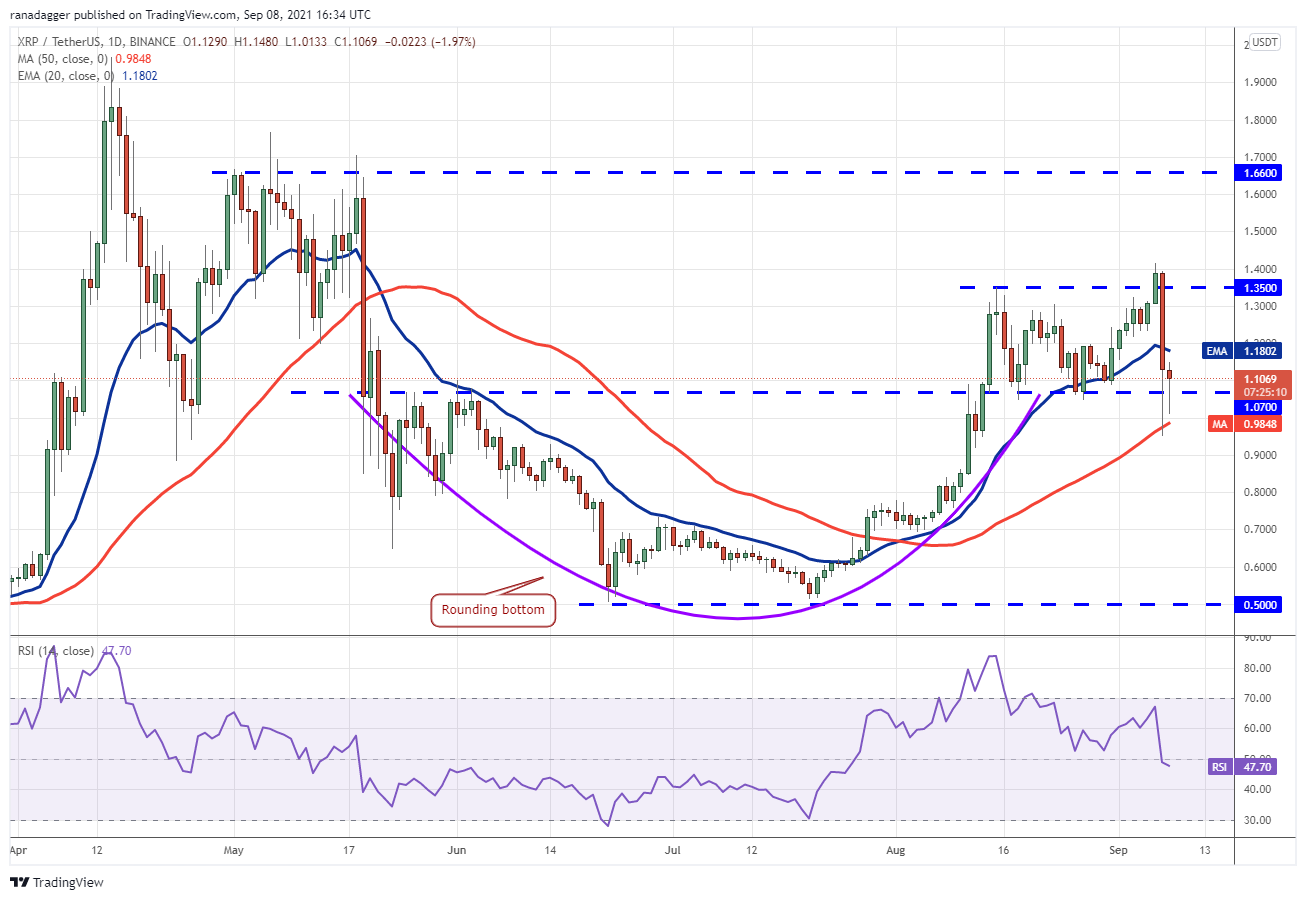
If they manage to do that, the pair could consolidate between $1.05 and $1.35 for a few days. On the contrary, if bears sustain the price below $1.05, the likelihood of a break below the 50-day SMA increases.
SOL/USDT
Solana (SOL) soared to a new all-time high at $198 on Sep. 8 but higher levels attracted profit-booking. The bears pulled the price down but the long tail on the day’s candlestick shows strong buying near the 50% Fibonacci retracement level at $130.84.
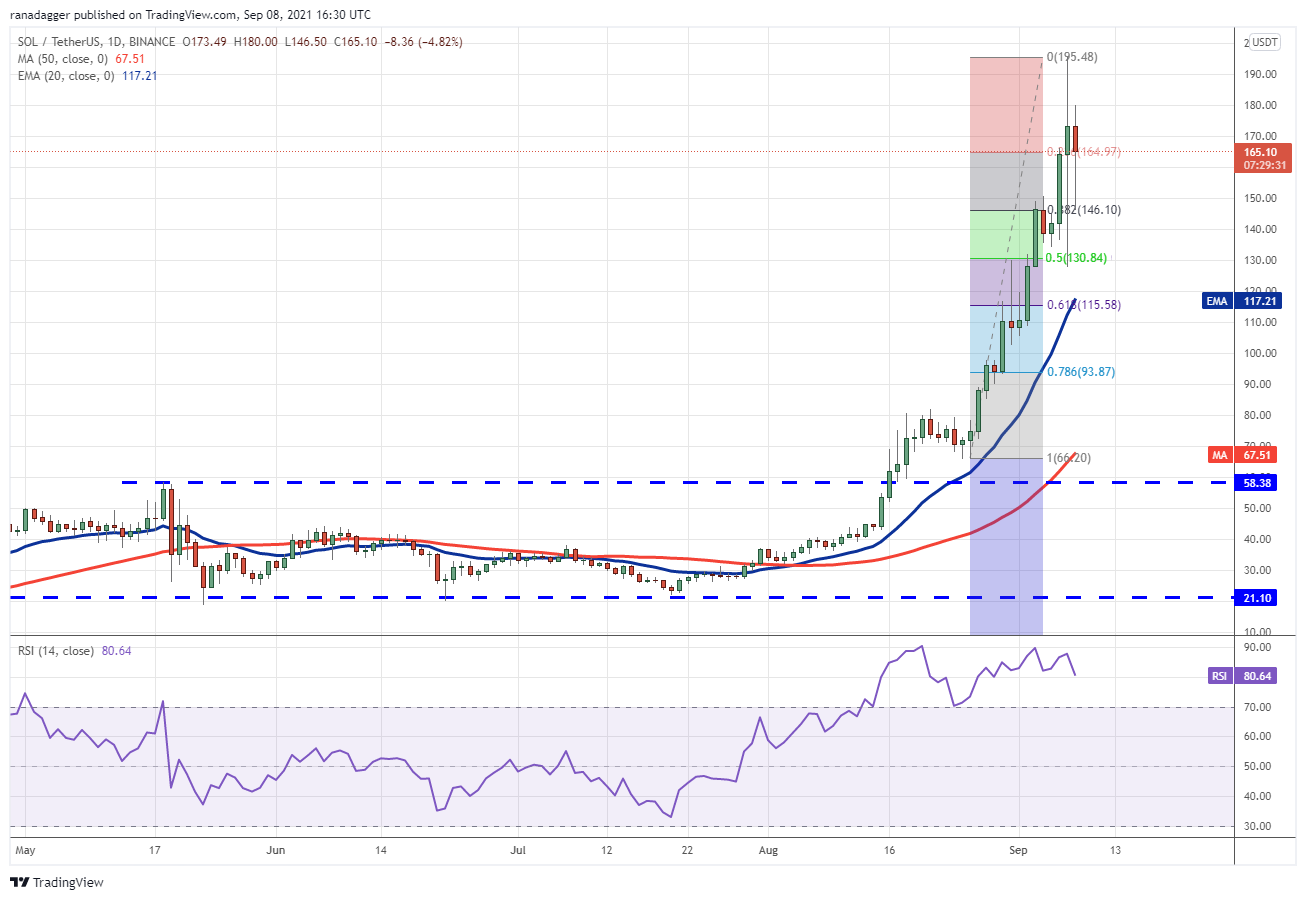
If the price bounces off this level, the pair may remain range-bound for a few days before starting the next trending move.
Alternatively, if the price turns up from the current level or rebounds off $146.10, the bulls will again try to push the pair toward $195.48. A breakout and close above this level may start the next leg of the uptrend.
DOGE/USDT
Dogecoin (DOGE) failed to pick up momentum after breaking out of the falling wedge pattern. The price slipped below both moving averages on Sep. 7, indicating strong selling by traders.
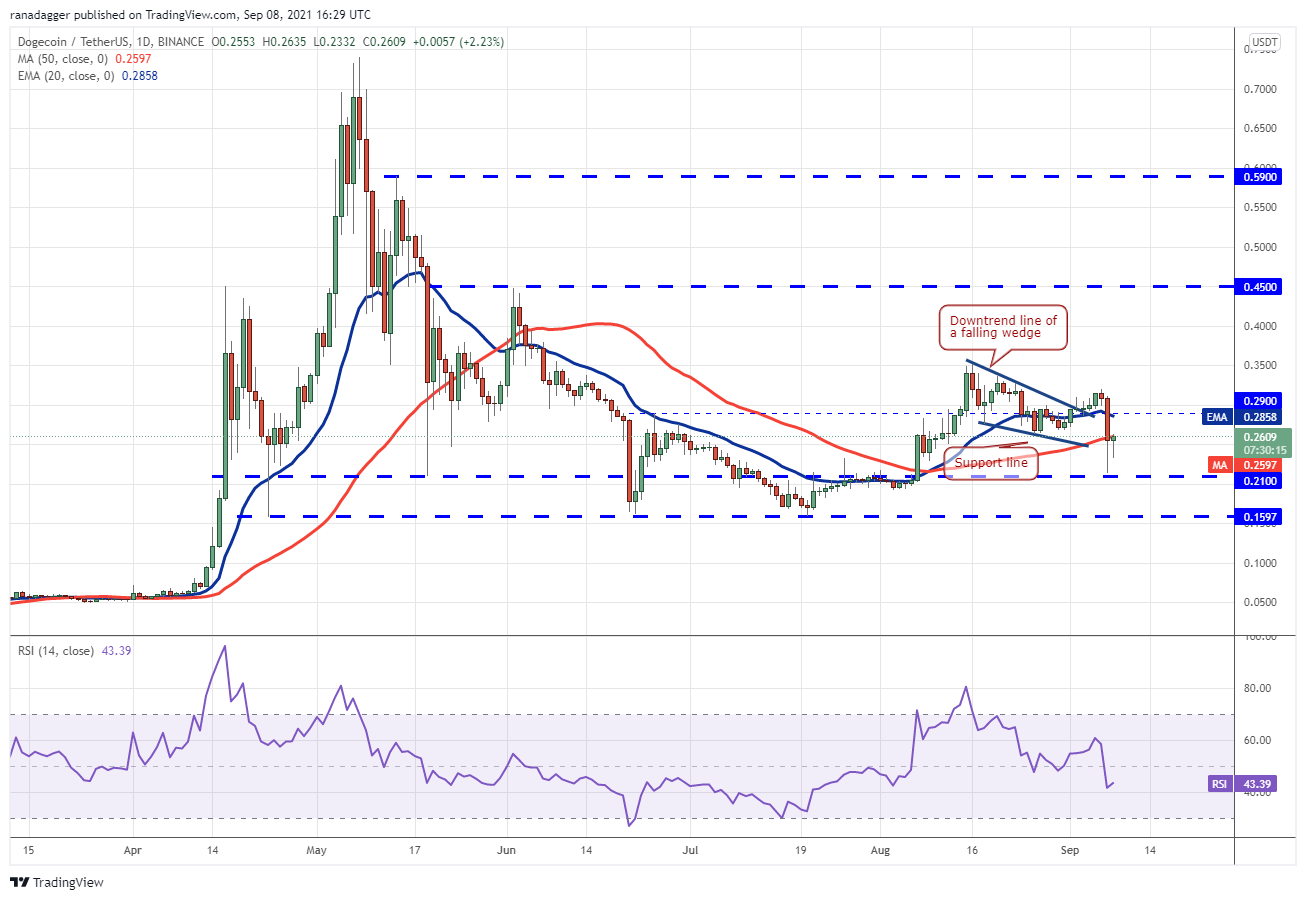
If bulls fail to push the price above the 20-day EMA ($0.28), the pair could witness another round of selling. A break below $0.21 could challenge the critical support at $0.15. The bulls will have to push the price above $0.32 to signal a comeback.
DOT/USDT
Polkadot (DOT) broke below the rising wedge pattern on Sep. 7. Aggressive selling pulled the price below the breakout level at $28.60, resulting in a fall to the 50-day SMA ($22.77).
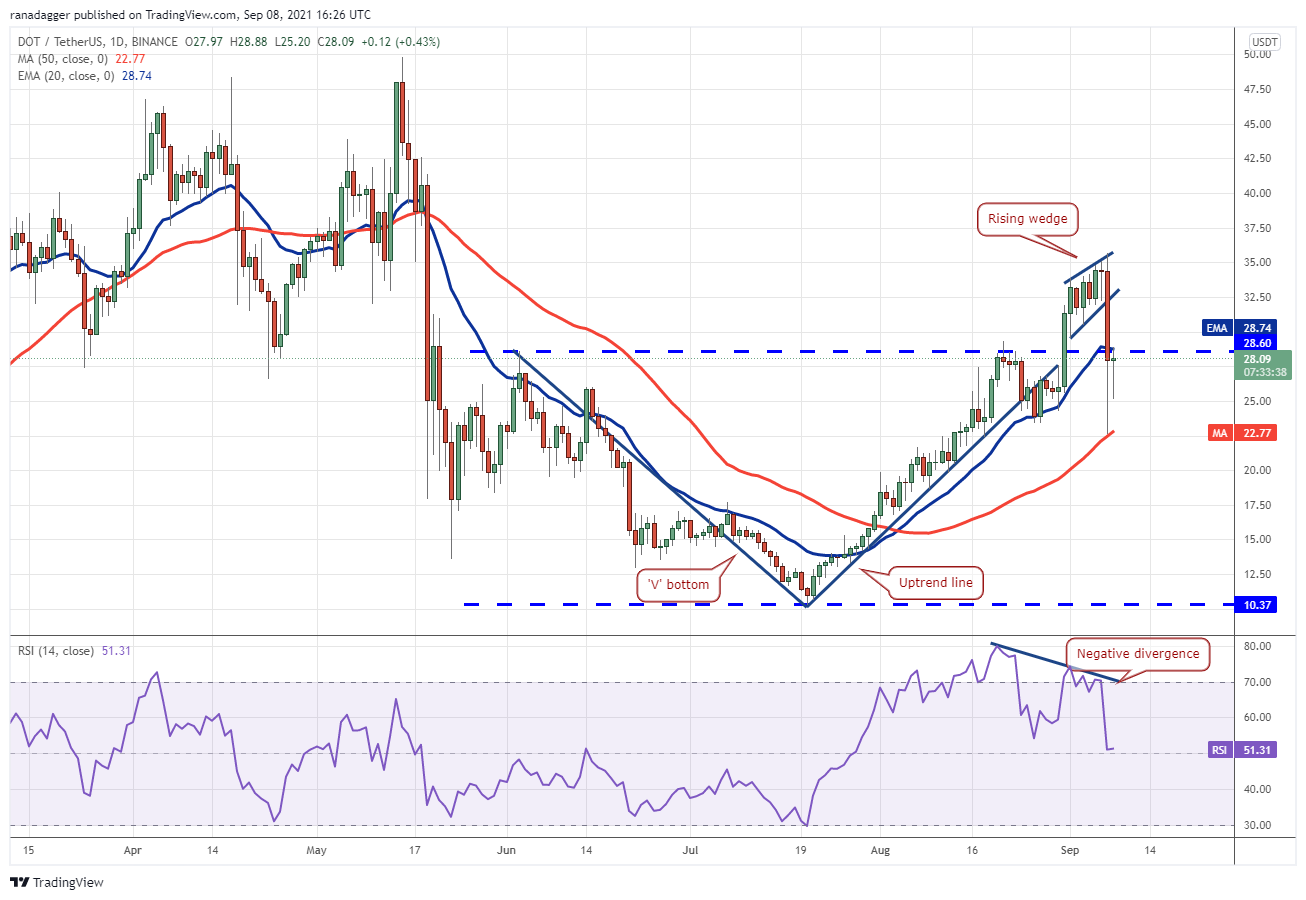
Conversely, if the price turns down from the current level, it will suggest that the sentiment has turned negative and traders are closing their positions on rallies. The bears will then again try to pull the price below the 50-day SMA. If that happens, it will suggest that the break above $28.60 was a bull trap.
Related: Sell or hodl? How to prepare for the end of the bull run, Part 2
UNI/USDT
Uniswap’s (UNI) range-bound action between $25 and $31.41 resolved to the downside on Sep. 7. The bulls tried to stage a recovery and push the price back above $25 today but failed.
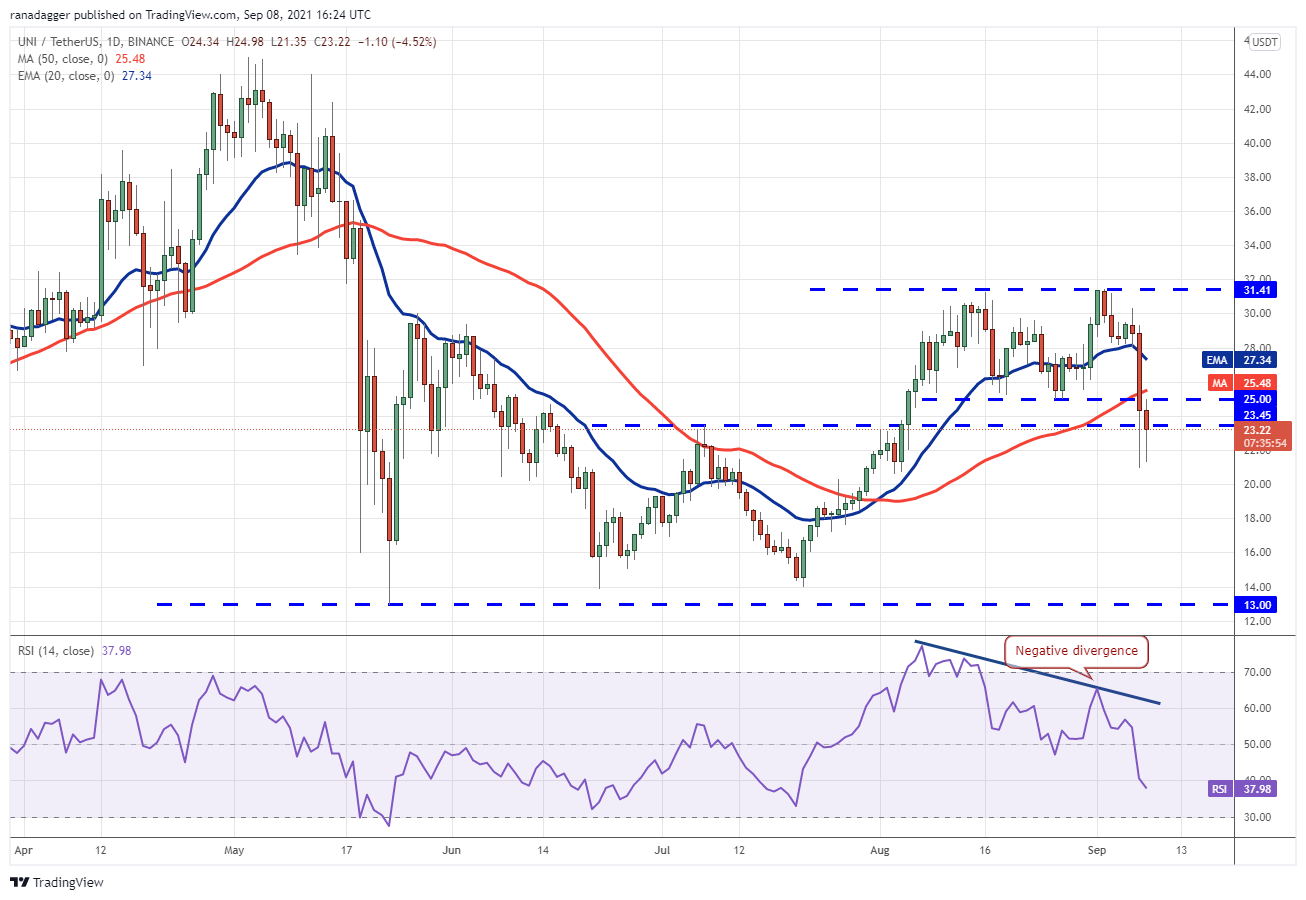
If they succeed, the UNI/USDT pair could drop to the pattern target at $18.69. If the price rebounds off this support, the pair may trade between $18.69 and $23.45 for a few days. The bulls will have to push and sustain the price above $25 to signal a comeback.
BCH/USDT
Bitcoin Cash (BCH) turned down from the overhead resistance zone at $806.90 to $864.30 on Sep. 7. This suggests that bears are aggressively defending the overhead zone. The altcoin could now remain stuck inside the large range between $383.50 and $864.30 for a few more days.
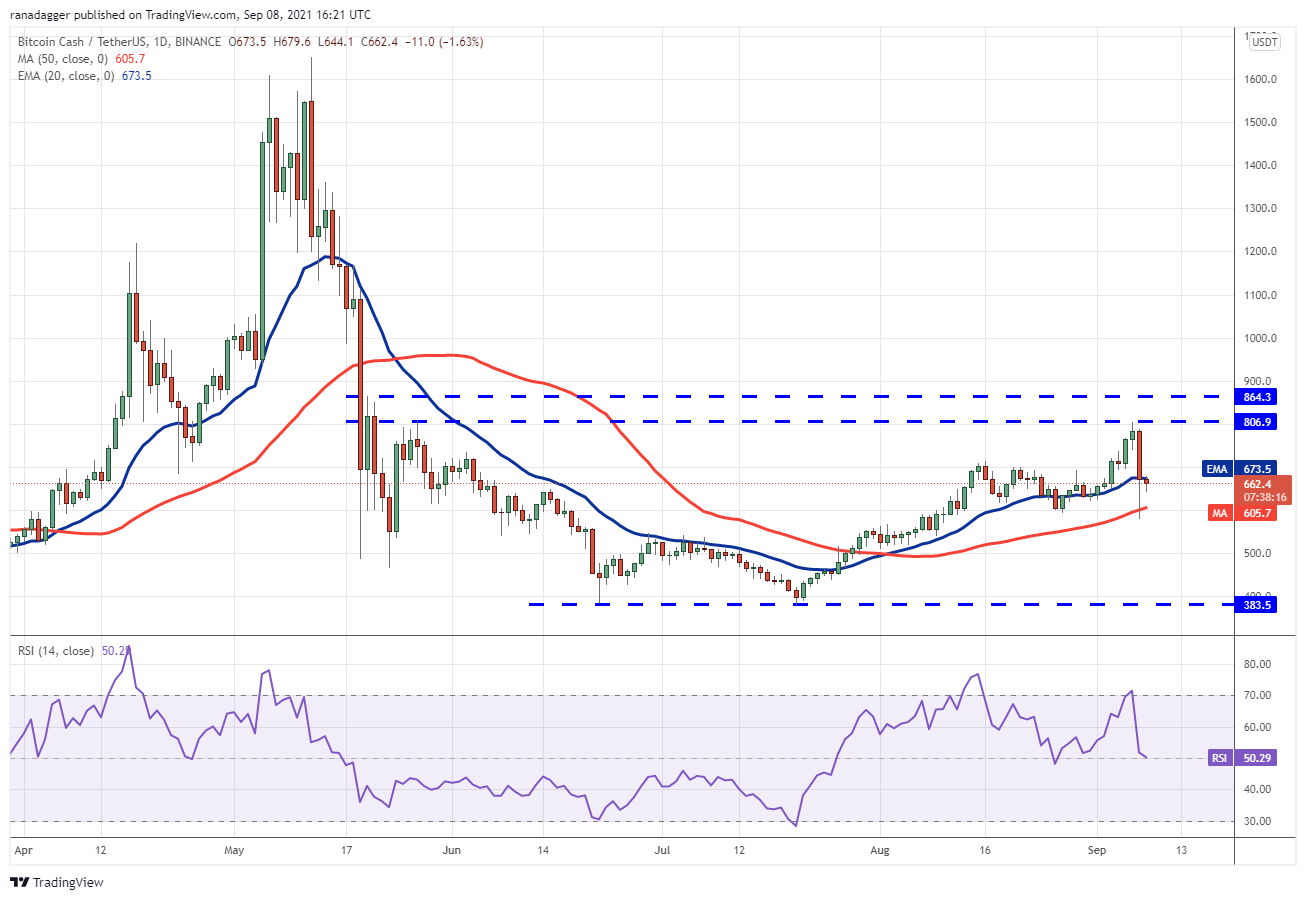
If the price turns down from the zone, the BCH/USDT pair could consolidate between $596 and $684.30 for a few days. A breakout and close above the overhead zone will indicate the possible start of a new uptrend while a break below $596 could open the doors for a further decline to $500.
The views and opinions expressed here are solely those of the author and do not necessarily reflect the views of Cointelegraph. Every investment and trading move involves risk. You should conduct your own research when making a decision.
Market data is provided by HitBTC exchange.

Leave A Comment