
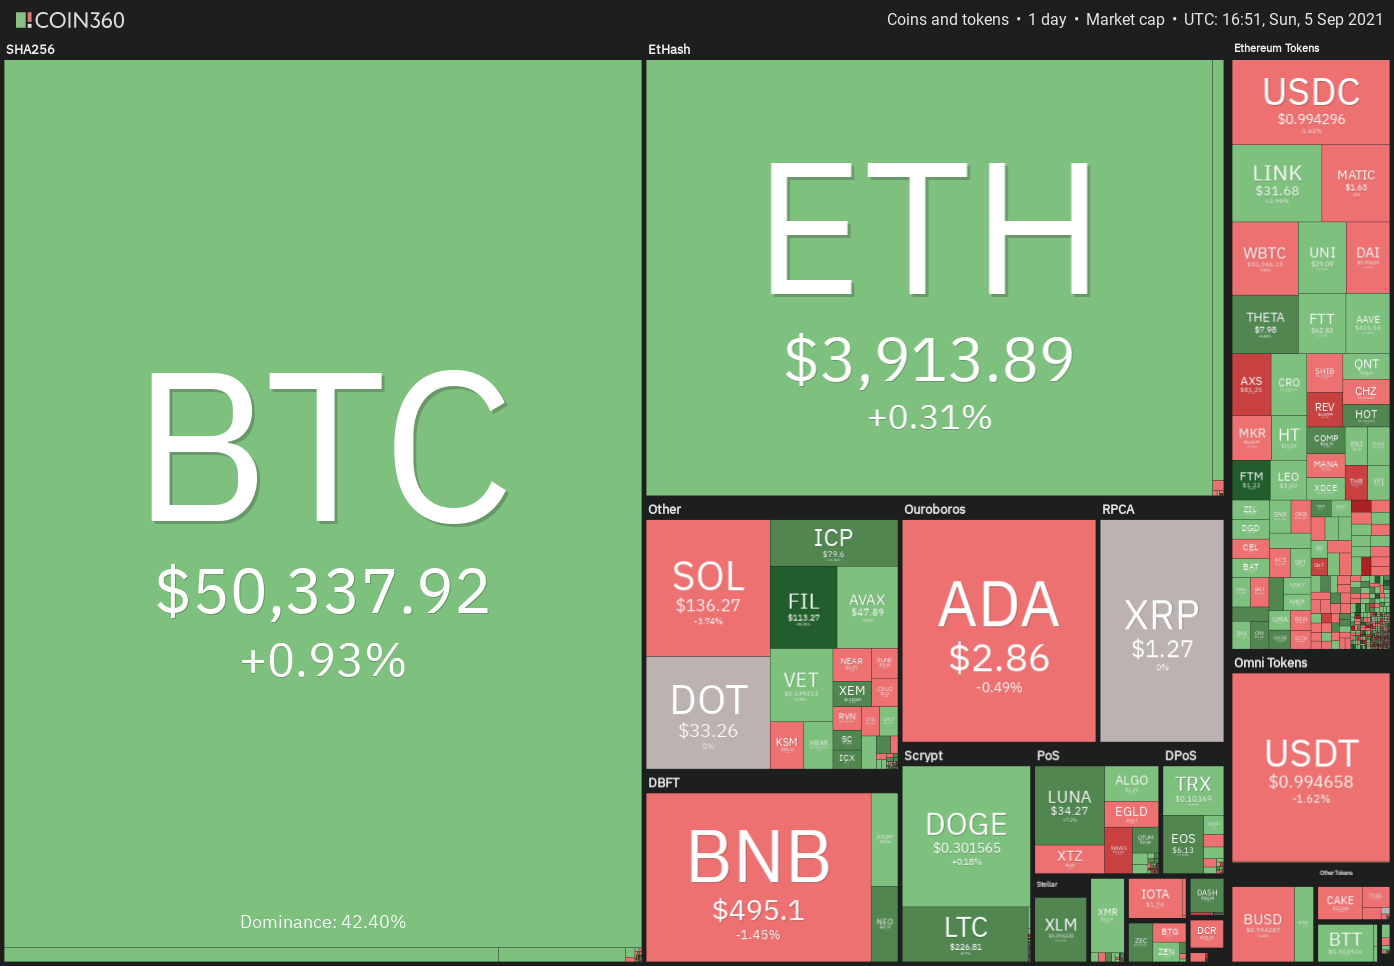
Bitcoin (BTC) is struggling to sustain above $50,500 but that has not stopped the altcoins from following in Ether’s (ETH) footsteps after the top-ranked altcoin hit $4,000 on Sept. 3. This has pushed Ether’s market dominance above 20% while Bitcoin’s dominance has shrunk to 41.1%.
However, Bitcoin’s hesitation in the past few days has not altered the outlook of Bloomberg senior commodity strategist Mike McGlone who has retained a $100,000 target on Bitcoin and $5,000 on Ether.
Let’s study the charts of the top-5 cryptocurrencies that may outperform in the short term.
BTC/USDT
Bitcoin broke above the $50,500 resistance on Sep. 3 to hit $51,000 but the long wick on the day’s candlestick suggests a lack of buying at higher levels. That was followed by a Doji candlestick pattern on Sep. 4, indicating indecision among the bulls and the bears.
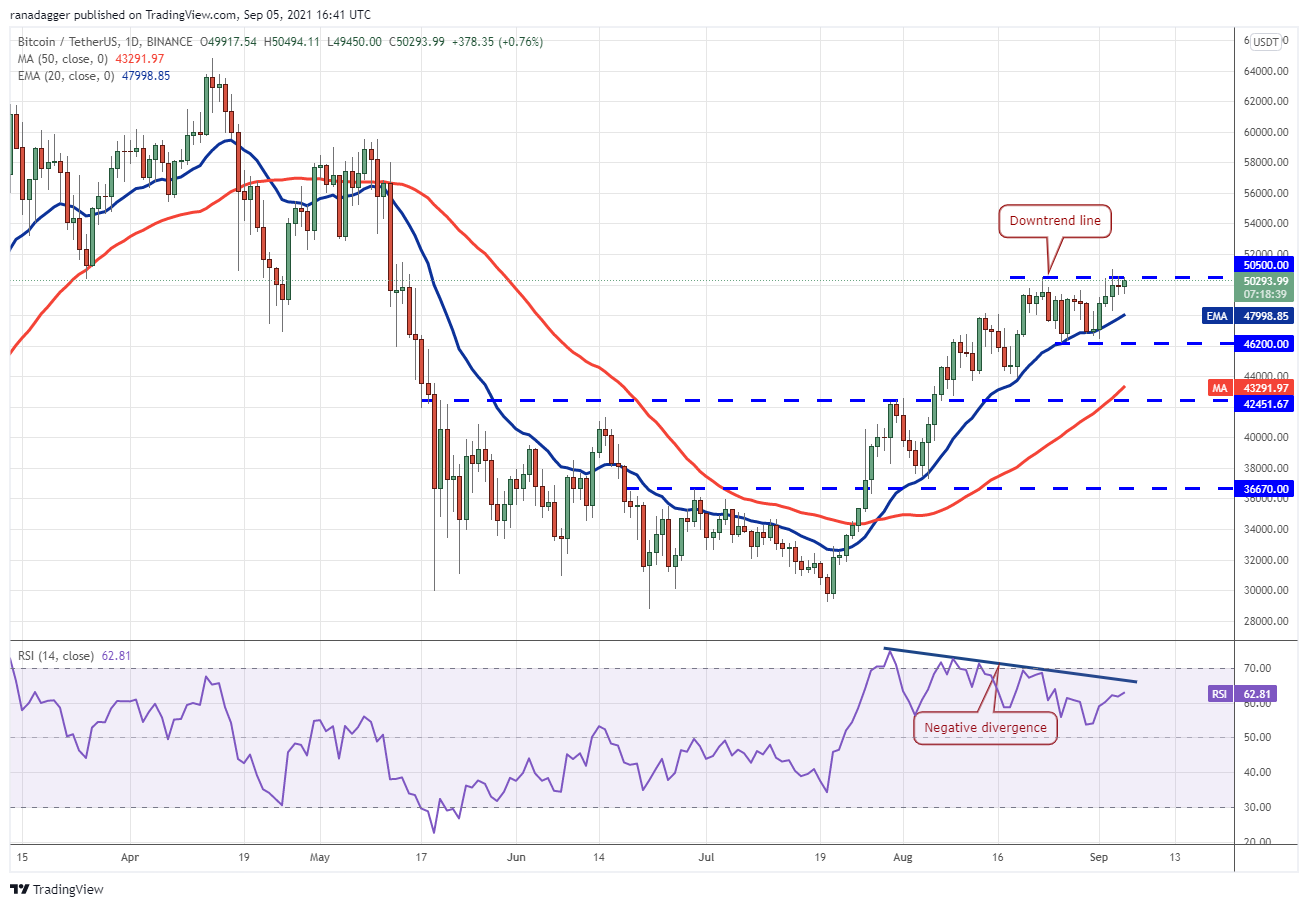
If buyers drive the price above $51,000, the BTC/USDT pair could resume its uptrend. The first stop could be $55,000 but if this resistance is crossed, the up-move could reach $60,000.
Conversely, if the price turns down from the $50,500 to $51,000 resistance zone, the pair may drop to the 20-day exponential moving average ($47,998).
This is an important support for the bulls because if it cracks, the pair may remain range-bound between $46,200 and $50,500 for a few days. A break and close below $46,200 could sink the pair to the 50-day simple moving average ($43,291).
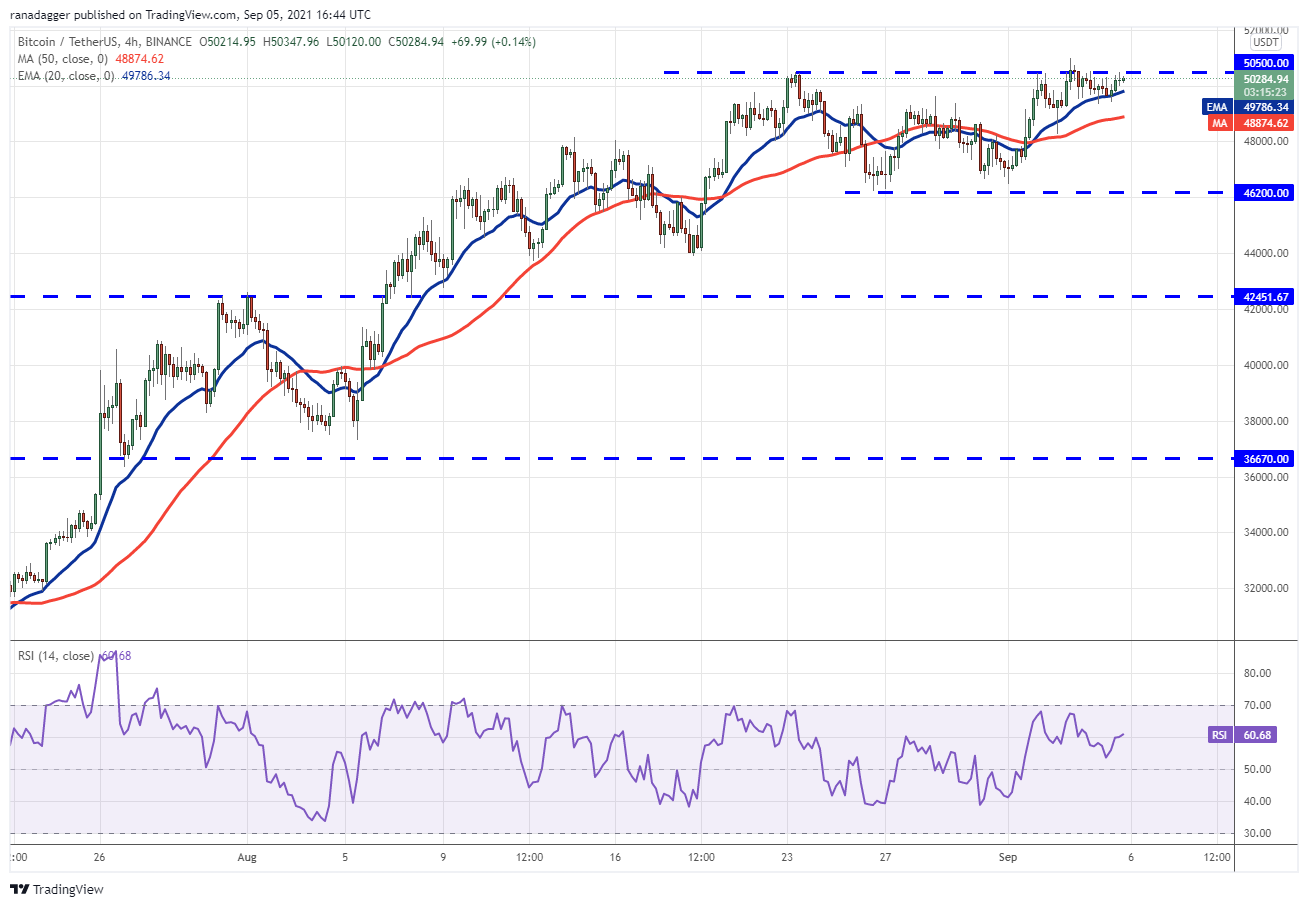
Alternatively, if the price slides below the moving averages, it will suggest that bears are aggressively defending the overhead resistance zone. That could pull the price down to $46,200. A bounce off this support could keep the pair range-bound for some more time but a break below it will indicate that bulls may be losing their grip.
LTC/USDT
The bulls are attempting to push and sustain Litecoin (LTC) above the overhead resistance at $225.30. If they succeed, it will complete a rounding bottom pattern that may start a new uptrend.
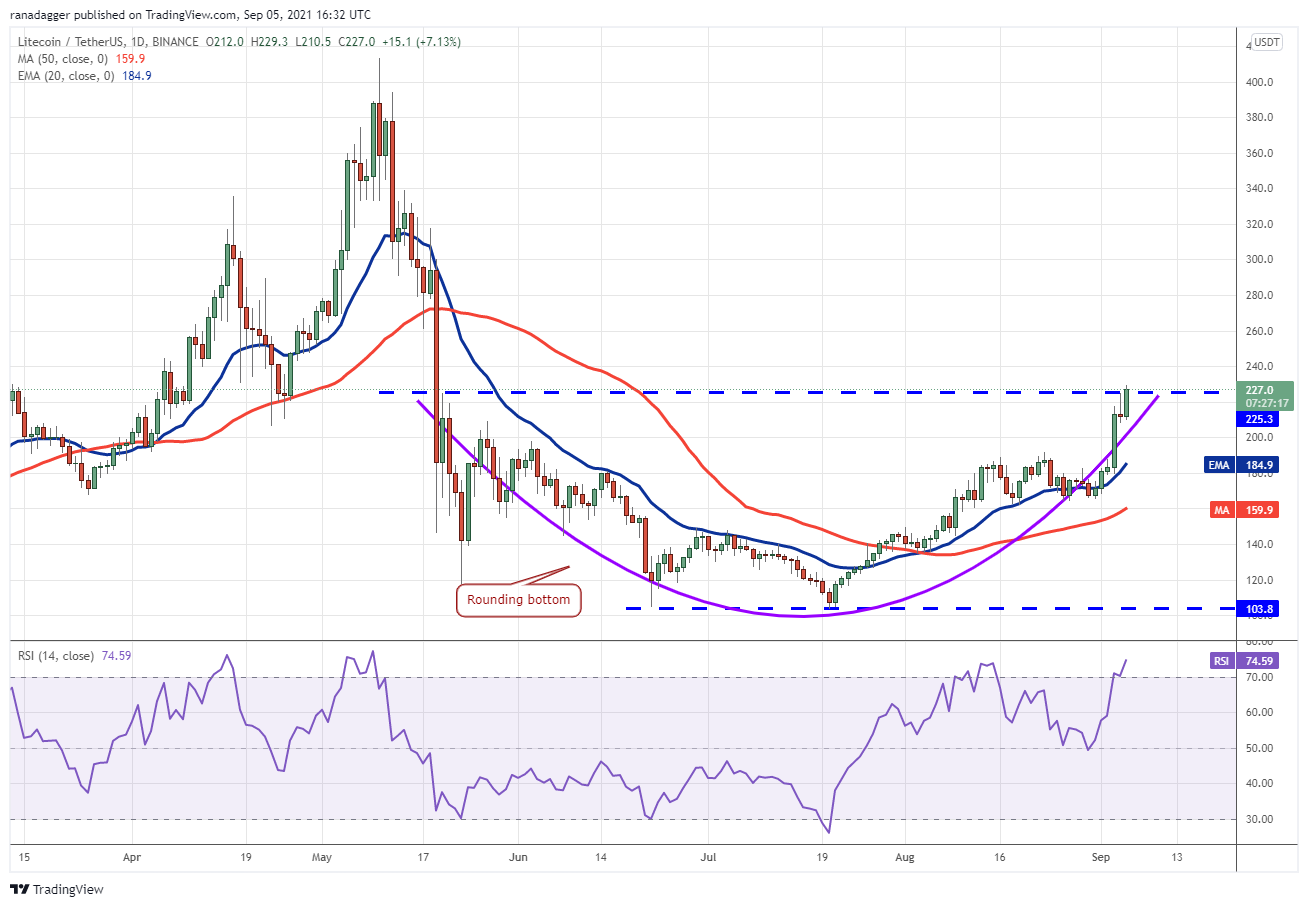
If they can sustain the price above $225.30, the LTC/USDT pair could start an up-move to $300 and later to the pattern target at $347.30. The rising 20-day EMA ($184) and the RSI in the overbought zone indicate the path of least resistance is to the upside.
This bullish view will invalidate if the price turns down from the current level and breaks below the 20-day EMA.
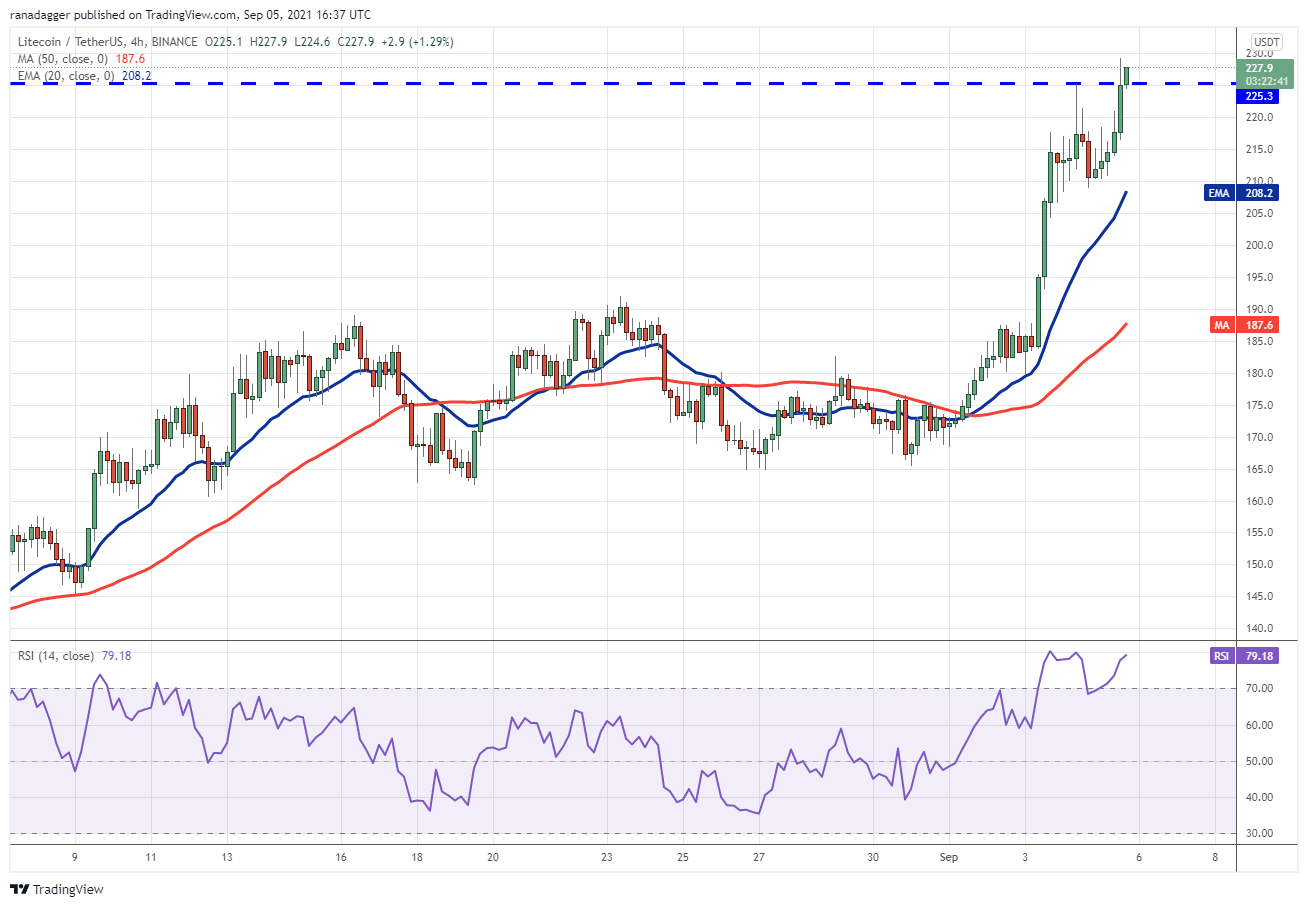
Both moving averages are sloping up and the RSI is in the overbought zone, indicating that bulls are in command. A break and close above $225.30 could open the doors for a rally to $250.40. Conversely, a break and close below the 20-EMA will be the first sign of weakness.
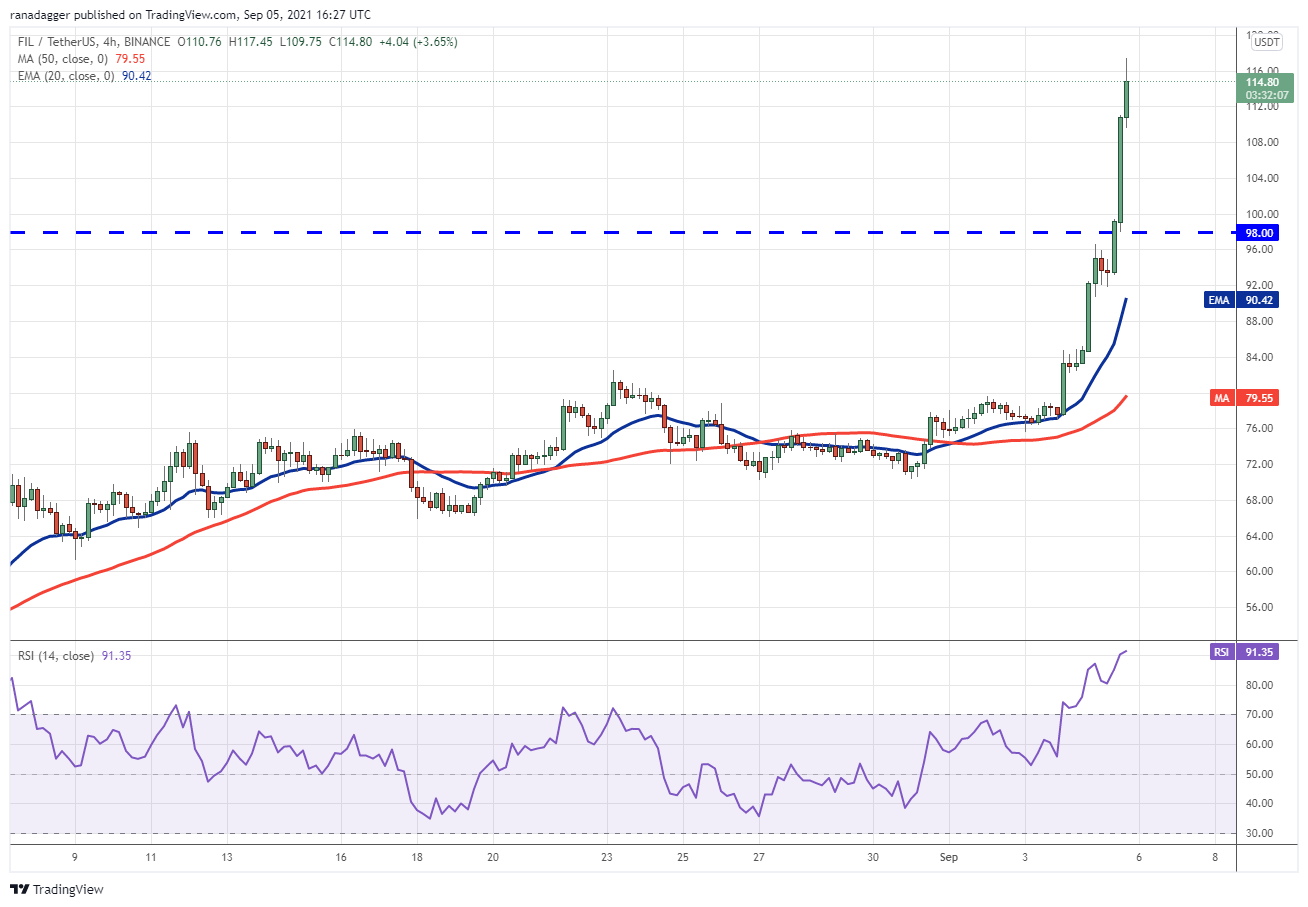
FIL/USDT
Filecoin’s FIL token has broken above the overhead resistance at $98 today. This completes a rounding bottom pattern, suggesting the start of a new uptrend. The bottoming formation has a pattern target at $156.
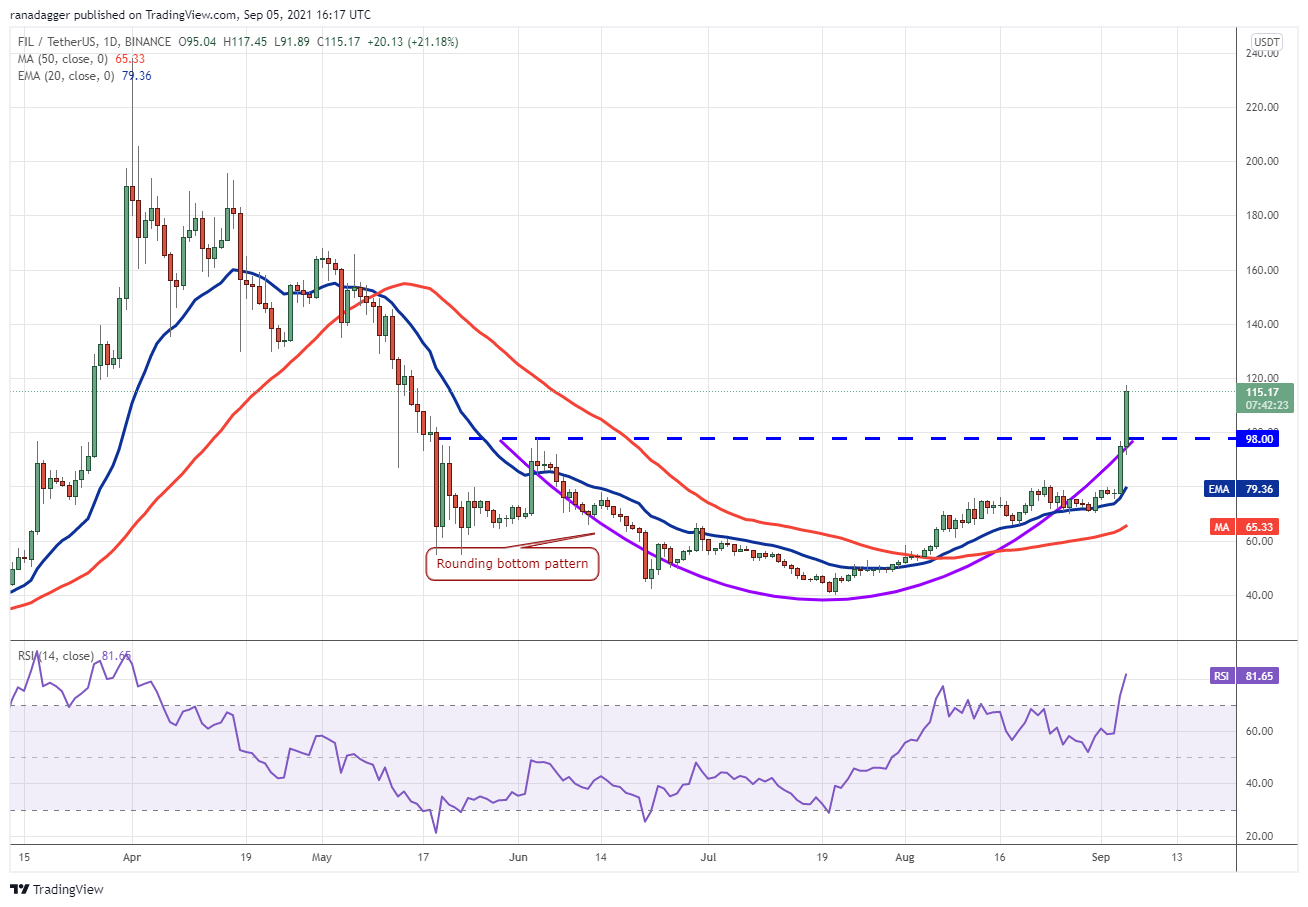
If bulls flip the $98 level into support, the FIL/USDT pair could resume its uptrend. On the contrary, if bears pull and sustain the price below $98, it will suggest that the recent breakout was a bull trap. The pair may then drop to the 20-day EMA.
If the price rebounds off this support, the bulls may once again try to propel the price above the overhead resistance and resume the uptrend. The bears will have to sink the price below the 20-day EMA to gain the upper hand.
If bulls do not give up much ground, it will suggest that traders are not booking profits as they anticipate another leg higher. That will increase the likelihood of the resumption of the uptrend.
However, the bears are likely to have other plans. They will try to pull the price back below $98 and trap the aggressive bulls.
FTT/USDT
FTX Token (FTT) broke above the previous all-time high at $63.13 on Sep. 1 and followed it up with a new all-time high at $70.72 on Sep. 2. A new all-time high is a sign of strength but the bulls have not been able to sustain the price above the breakout level at $63.13.
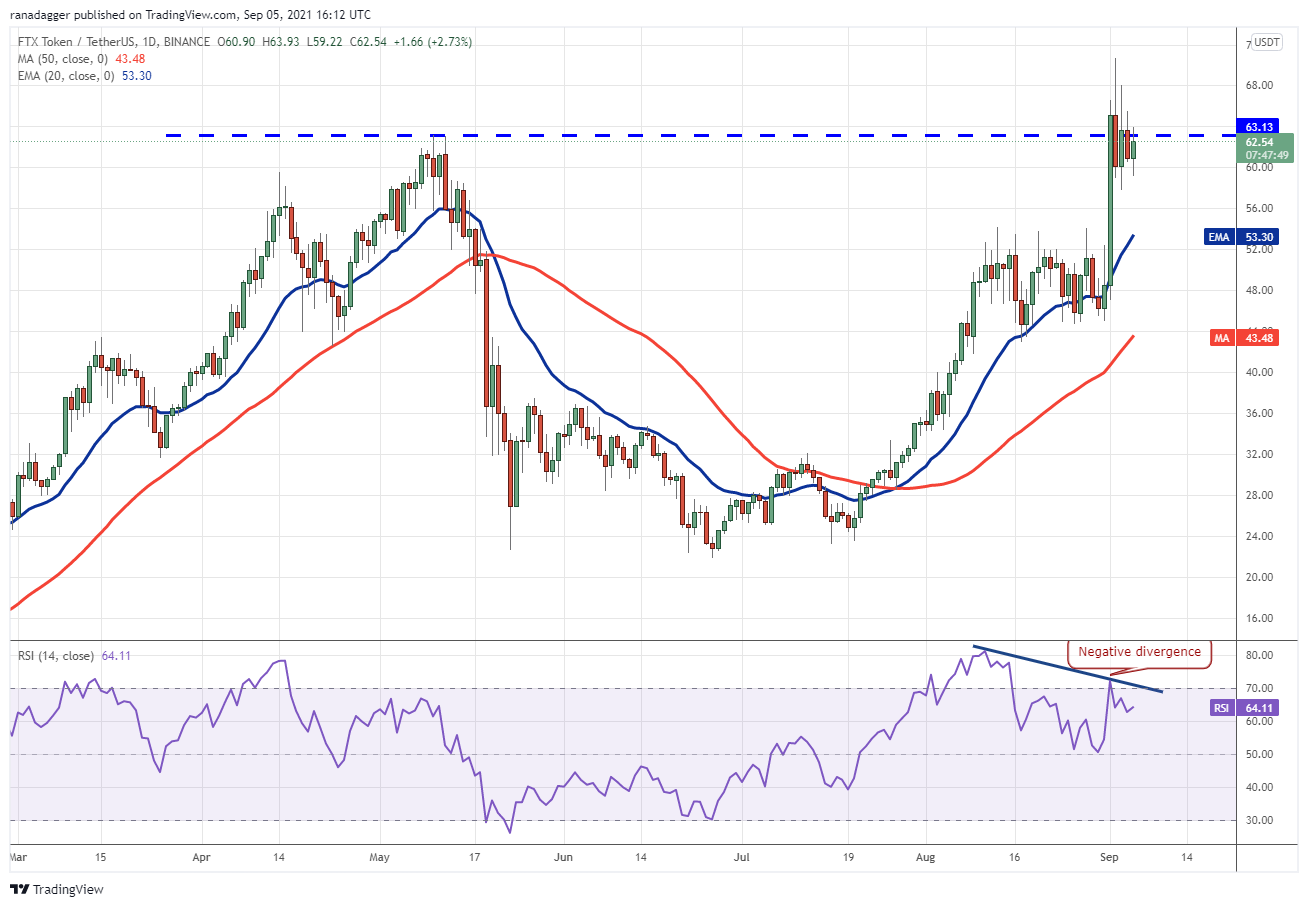
If bears pull the price below $57.93, the FTT/USDT pair could drop to the 20-day EMA ($53). A strong bounce off this level will suggest that bulls are accumulating on dips. The buyers will then again attempt to push the price above the $63.13 to $70.72 resistance zone. If they manage to do that, the pair could rally to $84.
This positive view will invalidate if the price breaks below the 20-day EMA. Such a move will suggest that the recent breakout above $63.13 was a bull trap.
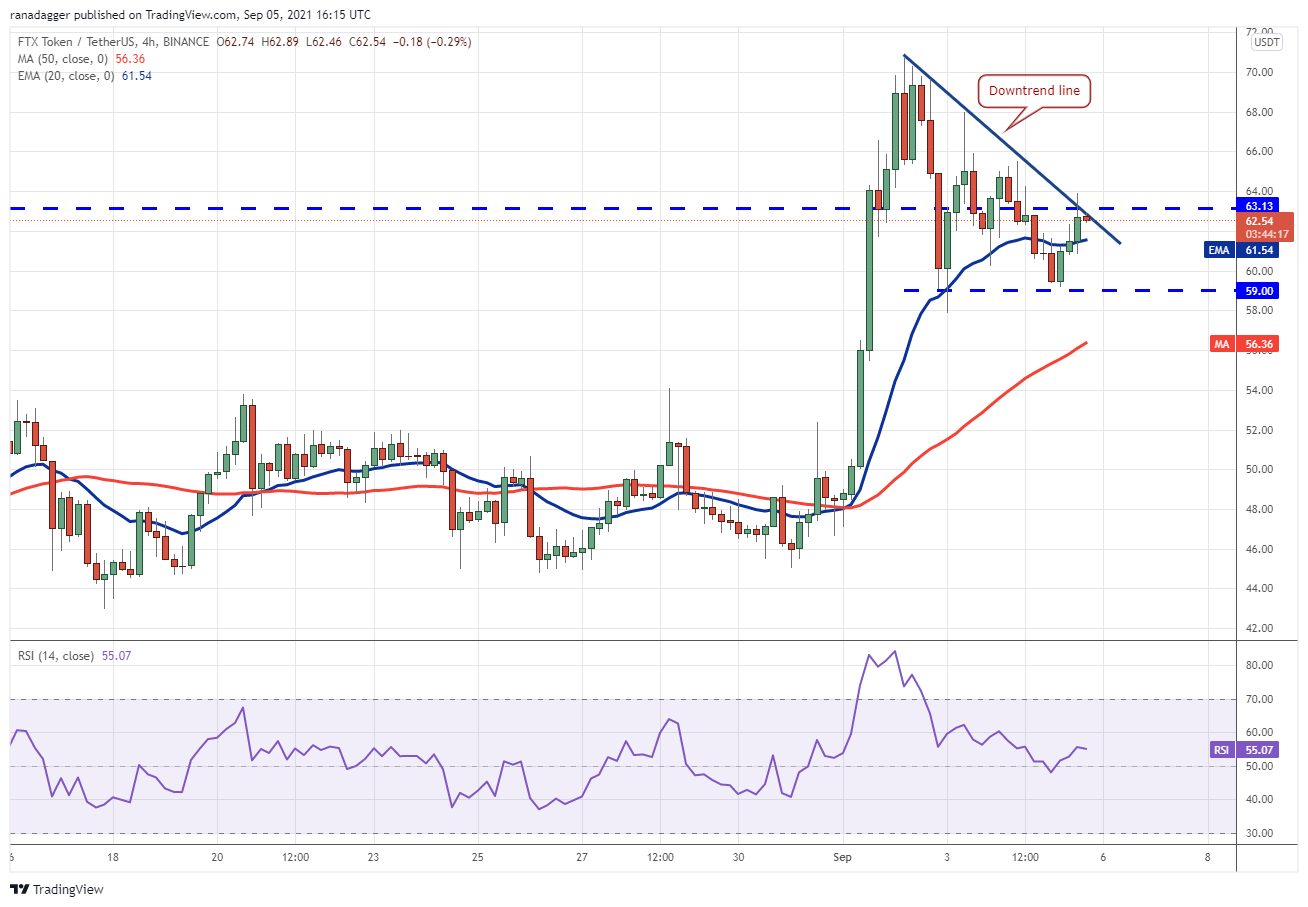
If buyers drive and sustain the price above the downtrend line, it will invalidate the bearish pattern. The price may then rally to $65 and later to $70.72. A breakout and close above this level could start the next leg of the uptrend.
Related: Nigeria plans CBDC rollout, Salvadoran retirees protest Bitcoin Law, Twitter to add BTC and ETH tipping feature: Hodler’s Digest, Aug. 29-Sept. 4
IOTA/USD
IOTA (MIOTA) rallied sharply from $0.96 on Sep. 1 to $2.08 on Sep. 4. This up-move pushed the RSI above 82, suggesting that the rally was overextended in the short term.
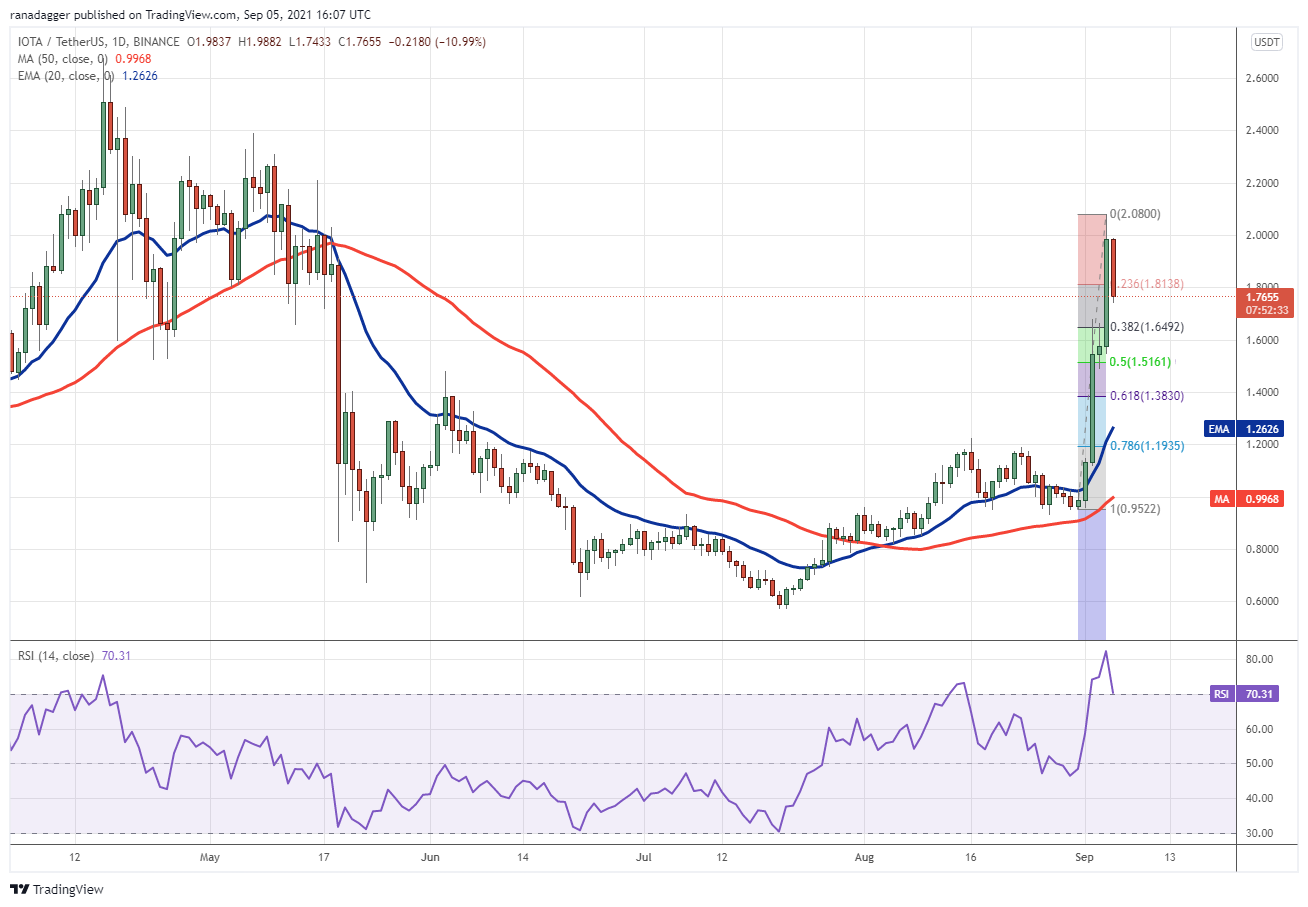
The bulls will then make one more attempt to push the price above $2.08. If they succeed, the pair could pick up momentum and rally toward $2.40 and then $2.67.
Alternatively, if bears pull and sustain the price below $1.64, the next stop could be in the zone between the 50% retracement level at $1.51 and the 61.8% retracement level at $1.38. A deeper correction could delay the start of the next leg of the uptrend.
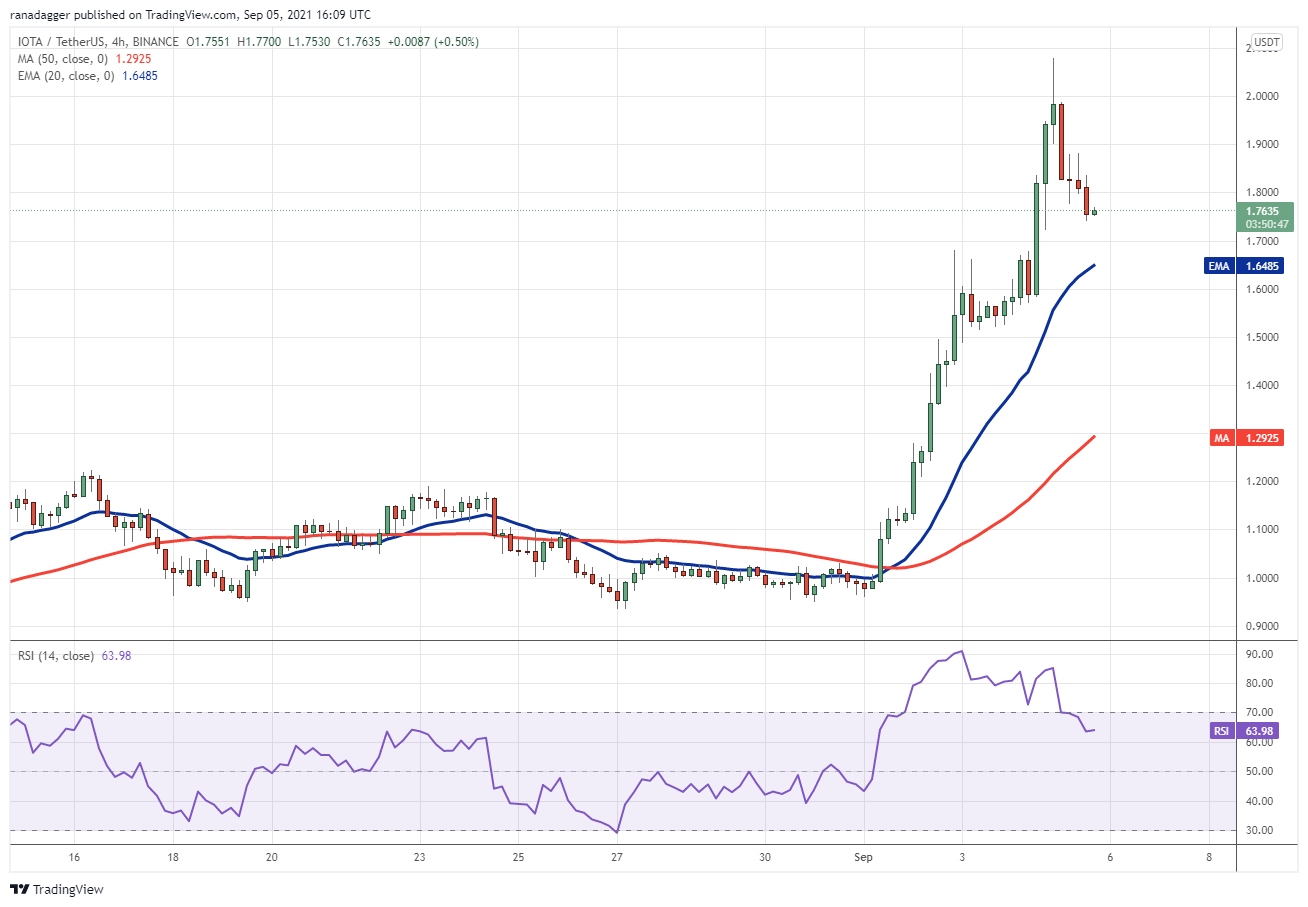
If the price rebounds off the 20-EMA with strength, it will suggest that the sentiment remains positive and bulls are accumulating on dips. The buyers will then try to resume the uptrend by thrusting the price above $2.08.
A break and close below the 20-EMA will be the first sign of weakness. That may open the doors for a further decline to $1.50.
The views and opinions expressed here are solely those of the author and do not necessarily reflect the views of Cointelegraph. Every investment and trading move involves risk, you should conduct your own research when making a decision.

Leave A Comment