
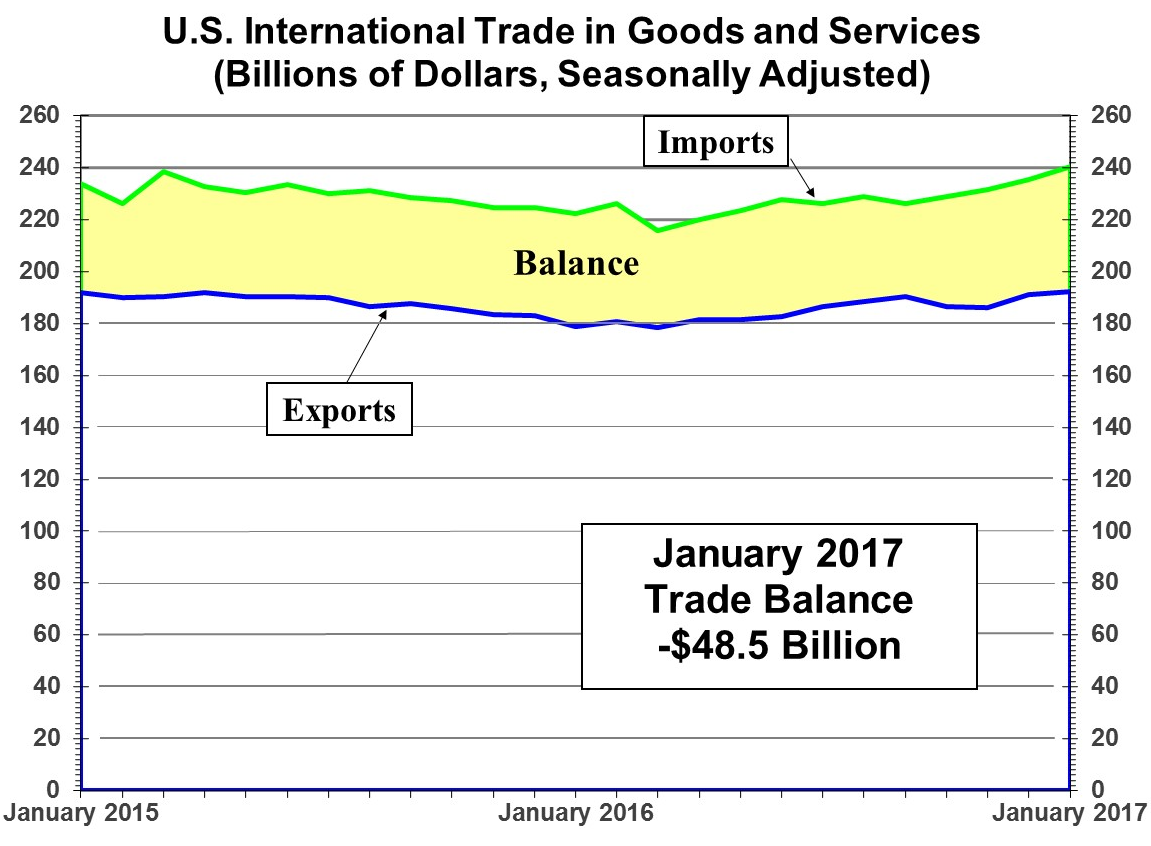
The International trade deficit widened to $48.5 billion matching the Econoday consensus. Don’t give the economists too much credit because the preliminary numbers on goods gave a big tip on what was going to happen. Today’s numbers reflect goods and service.
January’s trade deficit came in very deep but at least right on expectations, at $48.5 billion and reflecting a surge in foreign consumer and vehicle imports and higher prices for imported oil.
January imports rose 2.3 percent from December to $197.6 billion with imports of consumer goods jumping 2.4 percent to $52.1 billion and with vehicle imports up 1.3 percent to $13.6 billion. Petroleum imports totaled $15.3 billion in the month, up 19 percent and reflecting both higher prices, at $43.94 per barrel vs December’s $41.45, and a rise in volumes, at 8.4 million barrels per day vs 7.7 million.
Though dwarfed by imports, exports did rise 0.6 percent to $128.0 billion led by industrial supplies (where higher oil prices are at play) and also a 1.3 percent gain for vehicle exports to $13.6 billion as well as a $0.6 billion gain for foods. Exports of capital goods fell a sharp 1.9 percent to $43.5 billion in a decline that only partially reflected aircraft. Exports of services, usually the strength for the U.S., were unchanged in the month at $64.1 billion.
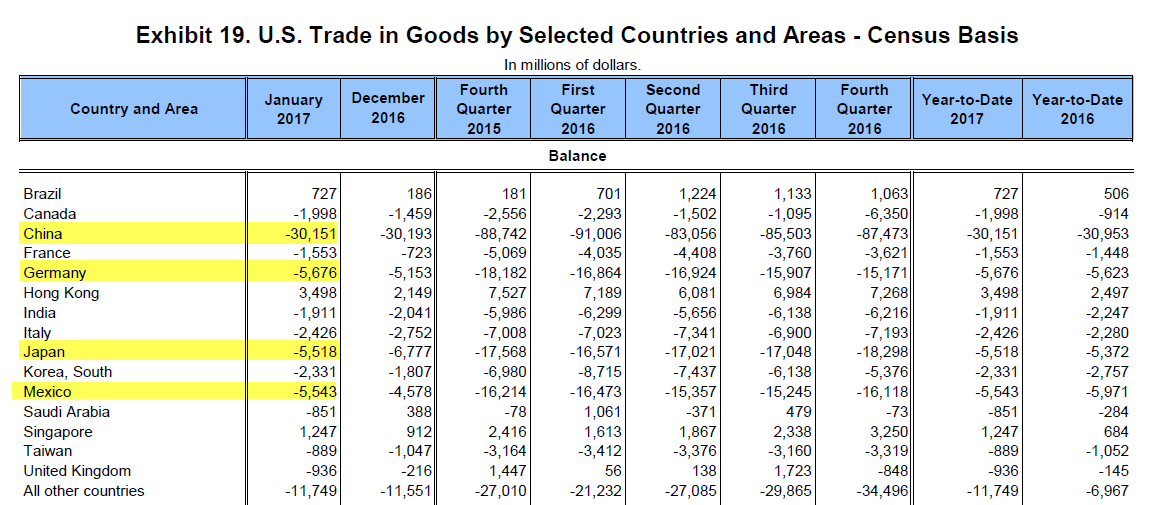
Unadjusted country data show a monthly widening with China, to a monthly deficit of $31.3 billion, and a widening with Canada, at $3.6 billion. Deficits narrowed with the EU, to $11.5 billion, with Japan, to $5.5 billion, and with Mexico, to $4.0 billion.
Strong demand for foreign goods and light demand for U.S. services and capital goods is not a favorable mix for GDP. This report puts first-quarter GDP on the defensive.
International Trade Goods and Services
Goods Trade Select Countries
Goods and Services Trade Select Countries


Leave A Comment