
Sometimes knowing what is happening beneath the surface tells you more than what we see on the surface of the markets. While the markets seem to be steady and lack volatility, the undercurrent is far from calm.
ZeroHedge reports, “One month ago we pointed out that the pain for active money managers is fast approaching unbearable status when according to a recent BofA analysis, the outflows from active funds in 2016 have surpassed a record $200 billion, with the bulk of cash outflows shifting over to much cheaper (and better performing) passive funds, though as BofA notes, flows have slowed since last year suggesting that there may be a broader cash outflow from the equity asset class, as increasingly more Americans retire and pull out of the market entirely.”
This may be an indication that the eye of the storm may be receding, but the next, more destructive phase of the storm may be approaching.

VIX closed above its Long-term support/resistance at 16.15, confirming its buy signal. The next important milestones are the trendline at 22.50 and Cycle Top resistance at 24.15 where a long-term breakout of the Bullish Flag may occur and the Cyclical uptrend may resume in earnest.
(ZeroHedge) While VIX remains subdued at bull-market-narrative-confirming levels, there are extreme concerns being exhibited in VIX options. There are currently almost 7 times more ‘call’ options (bets on a higher VIX) than ‘put’ options outstanding on the ‘Fear’ index – the highest since August 2015, just days before China devalued and the US equity market crashed.
SPX declines to key support

SPX bounced early this week, but closed beneath its Intermediate-term support/resistance at 2158.49, confirming the sell signal. In addition, weekly Short-term support/resistance has made a bearish cross of the intermediate-term support/resistance. However, the more important target may be that of the Orthodox Broadening Top with its lower trendline at 2120.00, where a break may trigger that formation. Should that support be broken, a panic may follow.
(RealInvestmentAdvice) The problem with going nowhere is that it makes managing money much more difficult. With the market having broken the bullish trend line from the February lows, as shown below, along with remaining overbought with a sell signal in place, the risk to the downside outweighs the potential for a further advance currently. With downtrend resistance from the previous highs pushing prices lower, the risk of a break below 2125 is elevated.Being a bit more cautious given the current technical backdrop will likely be prudent.
While there are many simply suggesting just to buy into passive indexes and hold them, the brutal reality to such strategies have destroyed the ability for many to ever actually reach their investment goals. However, despite the weight of evidence suggesting the markets are currently in a third bubble since the turn of the century, the commentary to ignore the outcomes related to such asset inflations is actually quite astonishing. Such is the result of a market seemingly immune to declines due to continued support, or at least belief thereof, from Central Banks.
NDX makes a new high, closes beneath Short-term support

In a surprising turnabout, NDX made a new high on Monday, then declined and closed beneath short-term support at 4818.16, leaving it on a sell signal at the end of the week. This behavior is leaving investors uncertain what to expect next. However, a decline beneath Intermediate-term support at 4768.59 confirms the sell signal. It may be imprudent to be long beyond that point.
(WSJ) U.S. stocks fell Friday, ending a week dominated by quarterly earnings reports.
The S&P 500 and the Nasdaq Composite fell this past week, while the Dow Jones Industrial Average posted a slight gain. The losses coincided with a selloff in government bonds that pushed yields to their highest levels in five months.
The Dow industrials fell 8.49 points, or less than 0.1%, to 18161.19 on Friday, and the Nasdaq Composite lost 25.87 points, or 0.5%, to 5190.10.
Government bonds stabilized after two days of sharp price declines. The yield on 10-year U.S. Treasury note edged higher Friday to 1.847%—its highest yield since May 27.
Stocks pulled back from earlier gains after the Federal Bureau of Investigation said it was reviewing new evidence in connection with its investigation of Democratic presidential candidate Hillary Clinton’s email server.
High Yield Bond Index consolidates

The High Yield Bond Index bounced early in the week, but eased back down, leaving a small gain for the week. The Cycles Model suggests more selling ahead.
(BusinessInsider) The fate of the bond market lies with a handful of giant investors.
The top five investment companies hold $264 billion in US high-yield bonds, according to a big report from Stephen Caprio and Matthew Mish at UBS. That’s equivalent to 20% of the market.
The top 20 hold $605 billion, equivalent to 46% of the US high-yield market, and mutual funds and separately managed accounts hold 70% of the market.
That could be a problem, according to Caprio and Mish.
In their report, the analysts explore what is called concentration risk and argue that having a high level of mutual fund ownership in the high-yield market could lead to wild swings in prices.

Related Posts
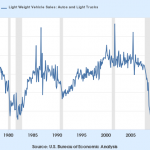 Light Vehicle Sales Per Capita – Our Latest Look At The Long-Term Trend
 FTX reportedly used Alameda’s bank accounts to process customer funds
 USD/JPY In A Cozy Holiday Range – Forecast Dec. 25-29, 2017
- Allstate Corp. Q1 Profit Beats The Street As Its All-Important Combined Ratio Falls
 Stocks: Thunder Dome
- S&P 500 – Dangerous For Bull Case, If Prices Turn Weak Here


Leave A Comment