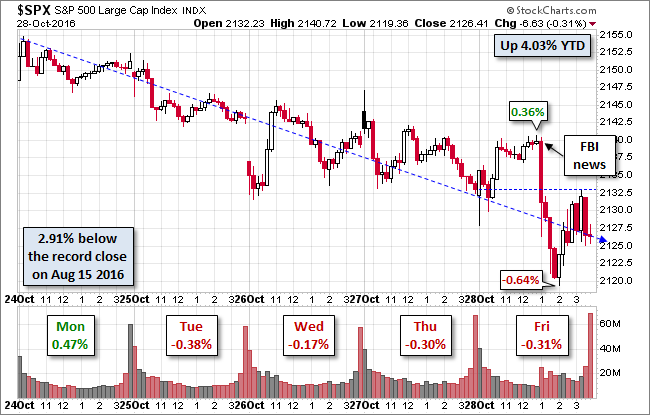
A surprisingly strong Advance Estimate of Q3 GDP preceded what appeared to be a reversal of the downtrend over the previous four sessions in the S&P 500. At the opening bell index digested the economic news (which might strengthen the odds of a Fed rate hike) and then rallied to a modest 0.36% mid-day high. But at 1 PM the FBI announced it was reopening its Hillary email probe. The index promptly sold off to its -0.64% intraday low. Not surprisingly, that triggered a “buy-the-dip” strategy, and the 500 rose to the level of yesterday’s close. But selling in the final 30 minutes dropped the index to its -0.31% Friday close.
The 10-year closed the week at 1.86%, up one BP from the previous close.
Here is a snapshot of past five sessions in the S&P 500.

Here’s a weekly chart of the index, which is down 0.69% from last Friday, the third weekly decline over the past four weeks.

A Perspective on Drawdowns
Here’s a snapshot of selloffs since the 2009 trough.

Here is a more conventional log-scale chart with drawdowns highlighted.

Here is a linear scale version of the same chart with the 50- and 200-day moving averages.

A Perspective on Volatility
For a sense of the correlation between the closing price and intraday volatility, the chart below overlays the S&P 500 since 2007 with the intraday price range. We’ve also included a 20-day moving average to help identify trends in volatility.


Related Posts
 Trade With Japan Collapses: Exports Decline 7th Month, Imports Decline 16th Month
 11 Stocks Building Wealth Through Higher Dividends
 Semiconductors Continue To Gain
 Sleepy Overnight Session Interrupted By Chinese Market Turmoil
 Forex Weekly Outlook – November 20-24
- The Secret To Achieving Warren Buffett’s Success


Leave A Comment