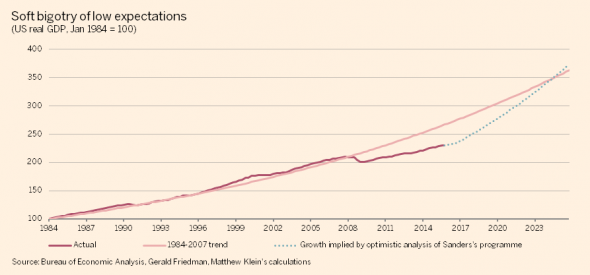
Matt Klein has defended the calculations in the Friedman study of the Sanders plan as “not extreme”. In particular he has used this graph to show that 5.3% sustained growth will only close the output gap toward the end of the projection period.

Source: Matt Klein.
One thing that should be remembered is that the trend line extrapolated from 1984-2007 implies that the output gap as of 2015Q4 is …-18%. A graphical comparison which highlights the implausibility of the -18% output gap is shown below:

Figure 1: GDP (blue), potential GDP from CBO (gray), and exponential deterministic trend estimated from 1984-2007 (pink). NBER defined recession dates shaded gray. Source: BEA (2015Q4 advance), CBO Budget and Economic Outlook, 2016-26 data appendix, NBER and author’s calculations.
By way of comparison, the CBO’s estimate is -2.2% (both in log terms). OECD estimates 2015Q4 output gap at -1.9%. [1] The IMF in its Article IV consultation with the United States estimated a gap of -1.6 percentage points of potential GDP for 2015, -0.7 percentage points for 2016. [2] If indeed the output gap is 18 percentage points, most mainstream economists would expect to see substantially lower core inflation than what we have observed thus far.
One could argue that low headline price inflation suggests more slack than these estimates indicate. I have two observations: (1) the most recent report of higher core CPI inflation runs counter to the presumption of enormous slack, and (2) using a modified Ball-Mankiw approach and the lower inflation back in 2015Q3, and assuming completely anchored inflation expectations, the implied gap was much smaller in absolute value terms than 18%.
Another way to resurrect the proposition that the assumptions built into the projections is to assert that the aggregate supply curve is very flat (see footnotes 16 in Friedman study).


Leave A Comment