
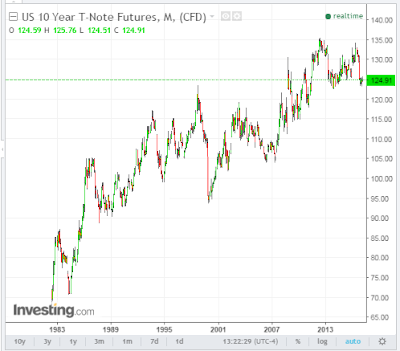
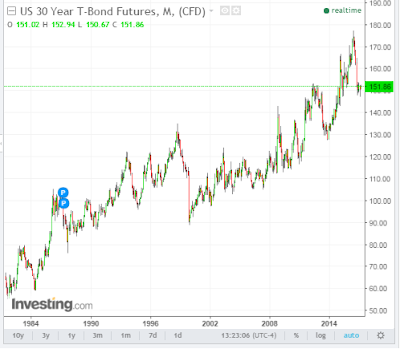
As can be seen from the following long-term view of 10 and 30 year bonds (monthly charts), each is facing an imminent decision… whether to break fairly substantial major support at their current levels and, potentially, fall to levels not seen since the 2008/09 financial crisis, or resume their flight-to-safety bounce to retest prior highs.
Further to my comments of March 25, it’s my opinion that if market players catch even a whiff of resistance by the majority of Congress to support and advance President Trump’s ambitious agenda, particularly as it relates to tax and regulation reform, infrastructure spending and national security, in a timely manner (i.e. by August or sooner) (not to mention a potential government shutdown after April 28), we’ll see money flow flood into bonds and out of equities.
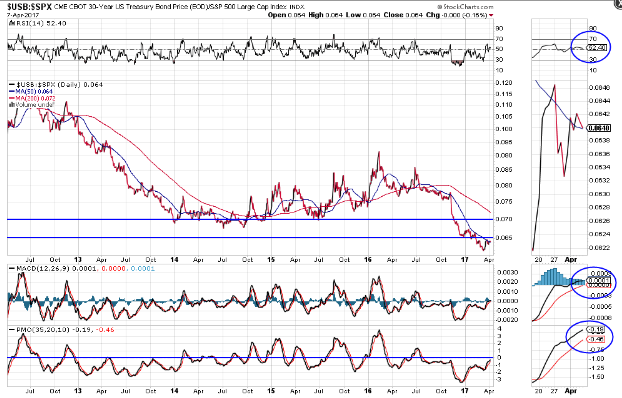
For example, watch for a break and hold above the 50 day moving average and near-term resistance at 0.065 on the following daily ratio chart of 30 Year bonds vs. SPX.
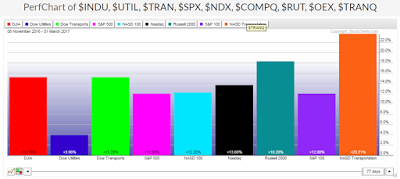
In the meantime, it’s difficult to ascertain what will move equity markets one way or the other, as they’re mired in a consolidation format after having made 3 Trillion dollar gains in four months (from the November 2016 election), as opposed to what would normally take about a year to achieve (as I had forecast for 2017 in my post of December 1, 2016).
Perhaps, with little major overhead price resistance, equities will form a new leg up, slowly and choppily, until such negative political alarm bells begin to ring. However, we may get an advance warning with bond money flow, as I’ve outlined above.


Leave A Comment