As we pointed out yesterday, October 9 was a landmark day: it marked 10 years to the day since the pre-Global Financial Crisis peak in the S&P 500. How have various asset classes performed since then? That is the question that DB’s Jim Reid set off to answer this morning in his latest edition of the “Early Morning Reid.”
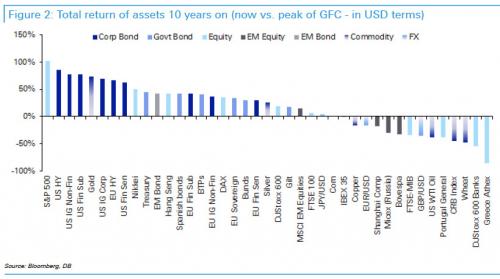
Here is what he found: to summarize in dollar terms, the S&P 500 (+102%) actually tops our list of 38 global assets even though this point 10 years ago was the local peak. This is followed by US HY (+85%) and 6 of the top 8 in dollar terms are credit assets. Gold (+74%) breaks up the top 8. 26 of the 38 assets are in positive total return territory since this point and 12 are in negative territory led by Greek equities (-85%), European Banks (-54%) with other major underperformers including Portuguese equities (-39%), Oil (-38%), FTSE-MIB (-34%), Bovespa (-33%), Russian Micex (-30%), Shanghai Comp (-18%) and the IBEX (-2%).
So although US equities and credit markets have shrugged off the impact of the crisis and have prospered, deep scars still remain especially for the European periphery and some EM equities (all dollar adjusted).
The chart showing the total return of key assets in USD terms is shown below…

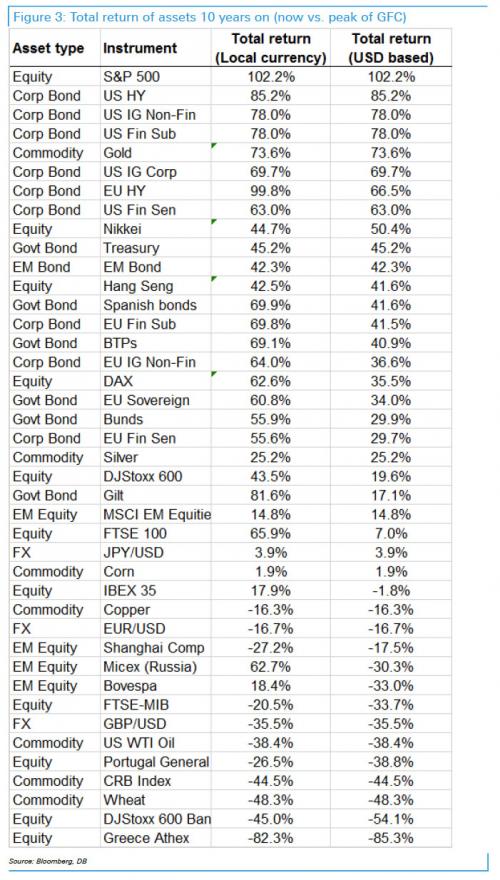
… while the following table breaks down 10-year returns in local and USD-terms:


Leave A Comment