
from the Bureau of Labor Statistics
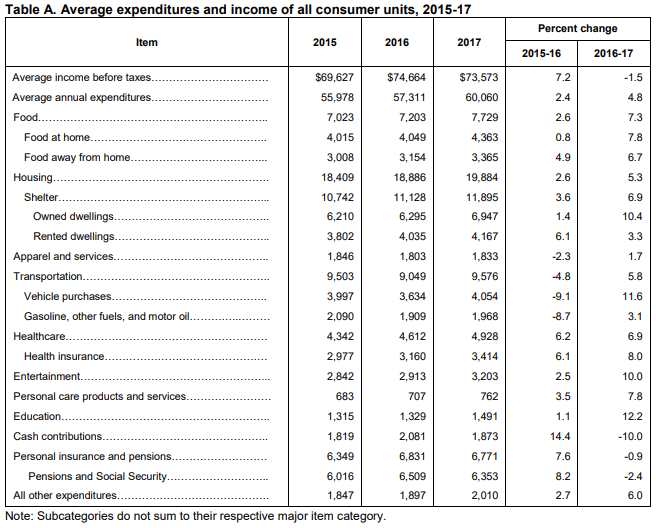
Average expenditures per consumer unit [1] for 2017 were $60,060, a 4.8-percent increase from 2016 levels, the U.S. Bureau of Labor Statistics reported today. During the same period, the Consumer Price Index (CPI-U) rose 2.1 percent, and average pretax incomes decreased slightly by 1.5 percent.

Eight of the 10 largest components of household spending increased during 2017. (See table A.) The 12.2-percent rise in education spending was the largest percentage increase among all major components, followed by a 10.0-percent rise in entertainment.
Spending patterns, 2017
Spending on food increased 7.3 percent. The increase was driven by both food at home spending, up 7.8 percent, and food away from home spending, up 6.7 percent.
Housing expenditures increased 5.3 percent. Expenditures on the two primary components of shelter, owned dwellings and rented dwellings were up 10.4 percent and 3.3 percent, respectively.
Transportation expenditures were up 5.8 percent, driven by vehicle purchases, which were up 11.6 percent, following a 9.1 percent decline in 2016. Gasoline, other fuels, and motor oil expenditures were up a modest 3.1 percent, the first increase since 2012.
Healthcare expenditures were up 6.9 percent, following a 6.2-percent increase in 2016. The largest component of healthcare, health insurance, was up 8.0 percent, following a 6.1-percent increase in the preceding year.
Footnote
1 Consumer units include families, single persons living alone or sharing a household with others but who are financially independent, or two or more persons living together who share major expenses.
Source


Leave A Comment