
Who’s Buying It?
With the market breaking out to all-time highs, the media has started to once again reach for their party hats as headlines suggest clear sailing for investors ahead.
While I certainly do not disagree the breakout is indeed bullish, and signals a continuation of the long-term bullish trend, there are more than sufficient reasons to remain somewhat cautious. Earnings are still weak, there is little evidence of economic resurgence and inflationary pressures globally remain nascent. But, for now, a rash of global Central Banks continue to support asset prices by increasing accommodative policies either through additional reductions in interest rates or direct injections of liquidity. As Matt King from Citi recently noted:
“It has been a surge in net global central bank asset purchases to their highest level since 2013.”
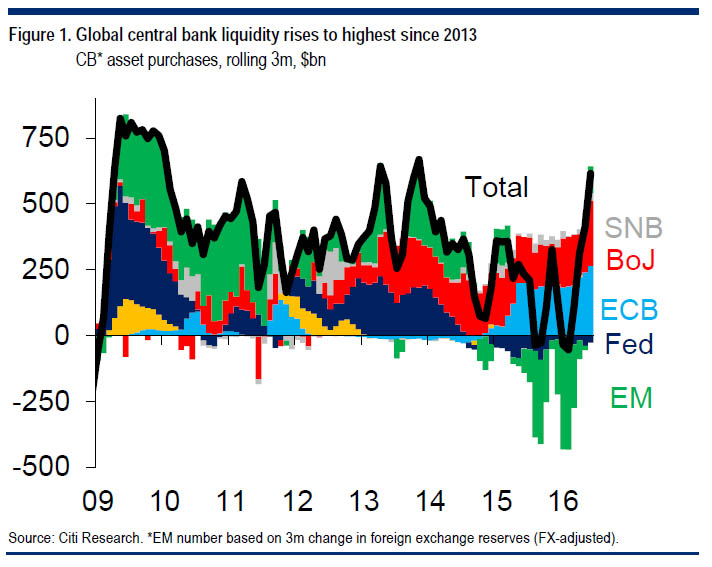
With the ECB in full QE mode, the BOC now using $300 billion in Pension Funds to prop up prices, and the BOJ now moving towards an additional $130 billion in QE as well, the liquidity push continues.
Interestingly, despite the push by Central Banks to loft asset prices higher, individual market participants as measured by the Investment Company Institute (ICI) have a different idea.
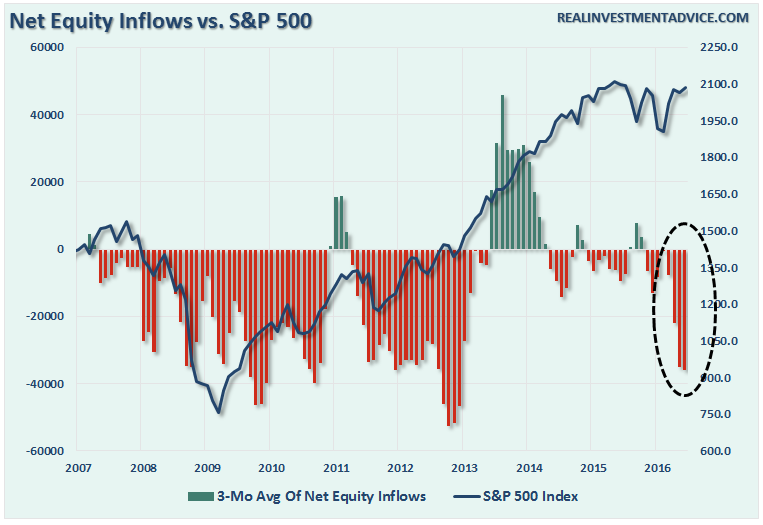
As shown in the chart above, despite asset prices ringing all-time highs, net equity inflows have turned decisively negative. This was much the same case following the 2012 market rout and it wasn’t until the launch of QE3 in 2013 that investors began to once again chase the markets.
The same can be seen for the American Association of Individual Investors as shown below.
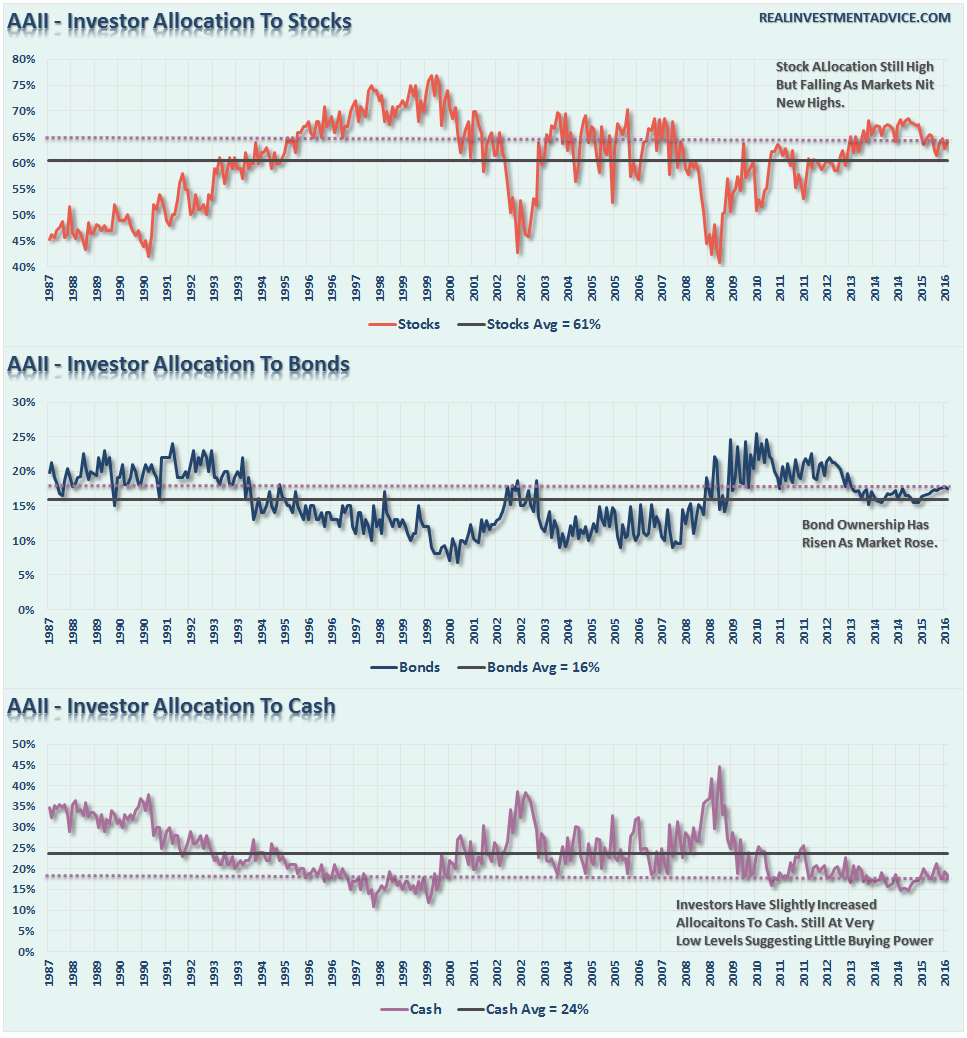
While the ICI chart above shows “net flows,” the AAII chart shows percentage allocated to stocks, bonds and cash.The recent decline in percentage of stock holdings confirms the recent net equity outflows from ICI.
However, despite the outflows from stocks, and increased allocation to bonds in recent months, the net exposure to equity risk by individuals remains at historically high levels with cash near historically low levels. Such suggests two things:


Leave A Comment