Debt Ceiling Resolved Soon?
Goldman Sachs lowered its odds of a government shutdown, caused by the debt ceiling not being raised, from 50% to 35%. These numbers are somewhat arbitrary because there’s no way of knowing the precise odds of a shutdown. This situation is like when analysts come up with price targets which include the cents. They are mocked because it’s unlikely their price target can be accurate down to the penny. The reasoning behind Goldman’s odds change is more important than the precise number. Goldman says the government shutdown would look bad as the relief efforts are still going on to help the people affected by hurricane Harvey.
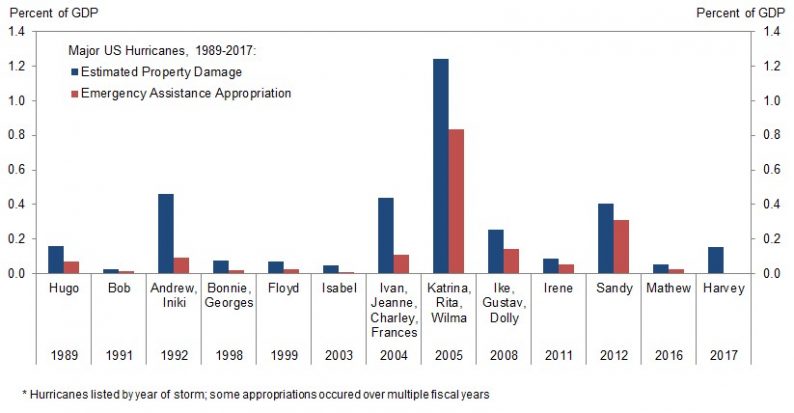
Given how bad the storm was and how many people were affected, relief efforts will still be going in 30-45 days when the debt ceiling will be breached. The chart below shows the estimated property damage in various historical storms. Lately, the betting market has been pushing the expectations for the ceiling being raised to an earlier date. The expectation is for something to get done between September 23rd and October 6th. That wouldn’t create much volatility in the stock market. The volatility will be determined by when it’s raised and the expectations for when it’s raised. If investors are confident a deal will get done, there won’t be a selloff even if it takes until October 6th. If the deal is uncertain until the last minute, the market can start declining in mid-September. Another weather-related aspect to this political scenario is that hurricane Irma looks like it might make a landfall in about 7-10 days. If that storm causes damage to any part of America, it will only bring more momentum to Congress to get a deal done. The parties aren’t on amicable terms, but even they can put partisanship aside to get something done to make sure the affected people get the help they need.

Bullish Charts
In a previous article, I discussed the bearish arguments which were gaining steam. Now let’s look at the trending bullish arguments. The chart below shows the fundamental stock market indicator compared to the S&P 500. The fundamental stock market indicator uses consumer comfort and the CRB raw industrials spot price index divided by the initial unemployment claims. As you can see, this isn’t a predictive metric, so it’s not saying the stock market will do well in the next year. All it does is confirm the latest movement in stocks. Personally, I wouldn’t say this is a great indicator because consumer comfort isn’t the best economic metric. I would use retail sales instead.


Leave A Comment