
Guest Post by Paul Kasriel, The Econtrarian
As quantitative easing comes to an end (apparently) by the Fed and is taken up by the European Central Bank (ECB), let’s compare the behavior of nominal domestic demand in each central bank’s economy and venture a reason for any differences.

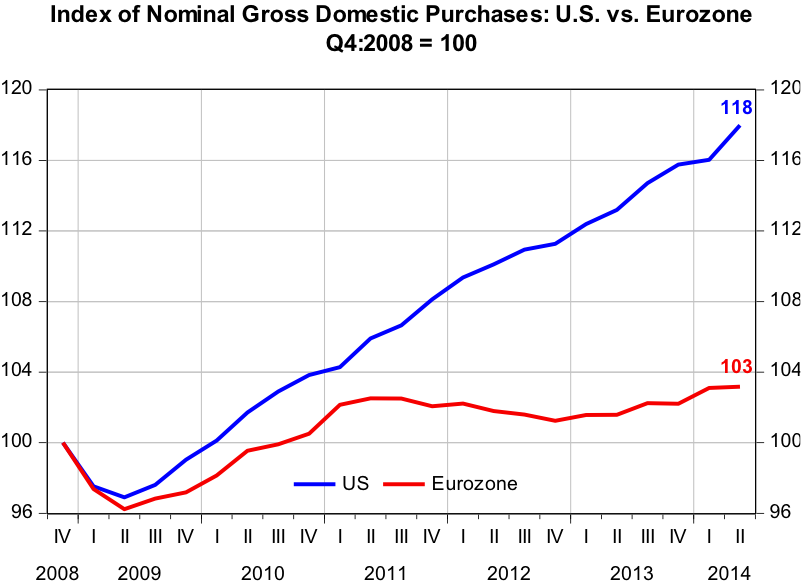
Plotted in Chart 1 are index values of the nominal Gross Domestic Purchases in the U.S. and the eurozone, respectively. Each index is set at a value of 100 for Q4:2008. Since Q4:2008, Gross Domestic Purchases in the U.S. increased a net 18% through Q2:2014 (that is what the index value of 118 indicates). For the eurozone, Gross Domestic Purchases increased a net of only 3% in this same time period. In terms of compound annual growth rates over this period, the U.S. experienced growth of 3.0% and the eurozone, just 0.5%.
Chart 1
Now, let’s examine the behavior of credit created by the central banks and depository institutions in each of these economies. This is credit that is created figuratively out of thin air. When central banks purchase securities in the open market, such as they do when they engage in quantitative easing (QE), they create credit out of thin air. When the depository institution system expands its loan and securities portfolios, it creates credit out of thin air. Credit created out of thin air enables the borrower to increase his/her current nominal spending while not requiring any other entity to reduce its current spending. Plotted in Chart 2 are index values of the sum of central bank and depository institution credit outstanding for the U.S. and the eurozone, respectively. Each index is set at a value of 100 for Q4:2008. Since Q4:2008, U.S. thin-air credit increased a net 28% through Q2:2014, which works out to be a 4.6% compound annual rate. In this same period, eurozone thin-air credit has contracted a net 2%, or at a compound annual rate of minus0.4%.
Chart 2
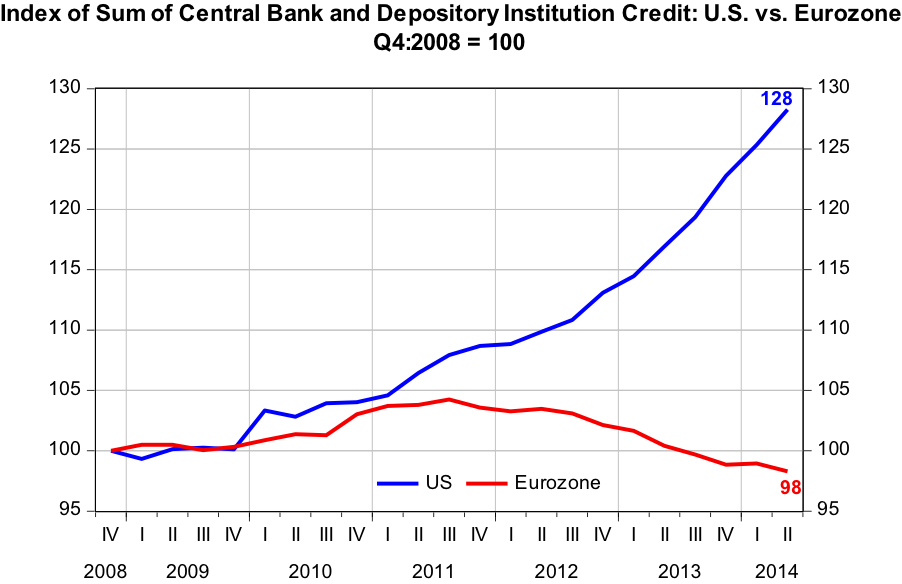
The Fed has engaged in QE in three separate phases in recent years, the first of which commenced in Q1:2009. From the end of Q4:2008 through the end of Q2:2014, U.S. thin-air credit increased a net $3.692 trillion, 82% of which was contributed by the Fed. During this same time period, the compound annual rate of growth in depository institution thin-air credit was only 1% rounded. Recall, that the sum of Fed and depository institution thin-air credit grew at a compound annual rate of 4.6% during this 22-quarter period vs. a long-run median annual growth rate of 7.4%. During this period, the ECB has refrained from engaging in QE and eurozone thin-air credit has contractedon net. Had the Fed not engaged in QE, U.S. total thin-air credit growth would have been quite weak, similar to what the eurozone has experienced.


Leave A Comment