AT40 = 48.1% of stocks are trading above their respective 40-day moving averages (DMAs)
AT200 = 54.9% of stocks are trading above their respective 200DMAs
VIX = 11.3 (a new all-time low!)
Short-term Trading Call: cautiously bullish
Commentary
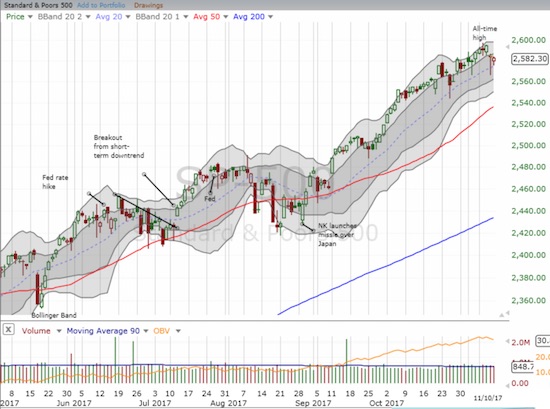
It was by the slimmest of margins, but the S&P 500 (SPY) finally ended the last week with a loss. After 8 straight weeks of gains, the index closed the last week with a 0.2% loss as Friday slipped by 0.1%.

The S&P 500 (SPY) survived a dip on Thursday, but slipped again on Friday. The uptrending 20-day moving average (DMA) is just barely holding as support.
For a hot minute, the dip on Thursday looked like the resolution of the bearish divergence which revealed the narrowing of the latest rally. The day looked very similar to a resolution from two weeks prior, but this time around the buyers were even more successful at erasing the losses with a same day reversal. Unlike the dip from two weeks ago, the next day did not deliver buying follow-through. Interestingly, the trading placed the volatility index, the VIX, right back to where it was two weeks ago with a gain of 7.5% on the day and 24% for the week.
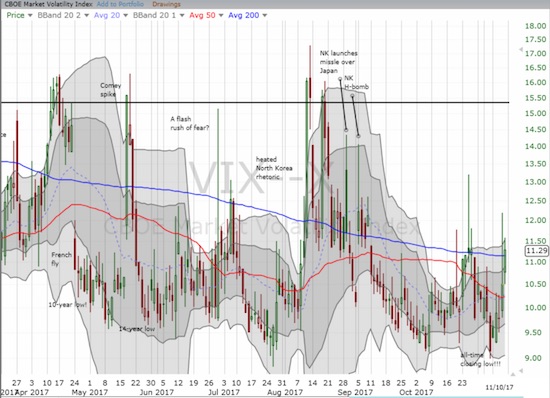
The volatility index, the VIX, came alive this week and actually fought off the automatic volatility faders.
The iShares Russell 2000 ETF (IWM) became the highlight of the narrowing rally. IWM has declined almost steadily since its last closing all-time high 5 weeks ago. Critically, IWM spent the last three days struggling to hold onto its 50DMA support.
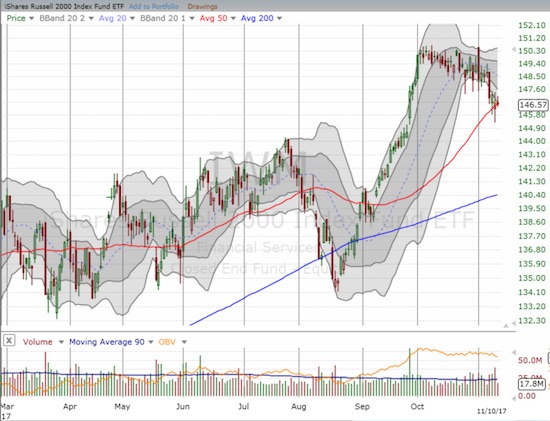
The iShares Russell 2000 ETF (IWM) is cooling off from a sharp rally off the August low. The 50DMA line of support has so far halted the slide.
Financials also contributed to the resolution of bearish divergence by buckling the past week off a 10-year high. Like IWM, the Financial Select Sector SPDR ETF (XLF) has its 50DMA creating a critical support line. I am watching closely for a buy-the-dip opportunity to load up on a new tranche of call options.
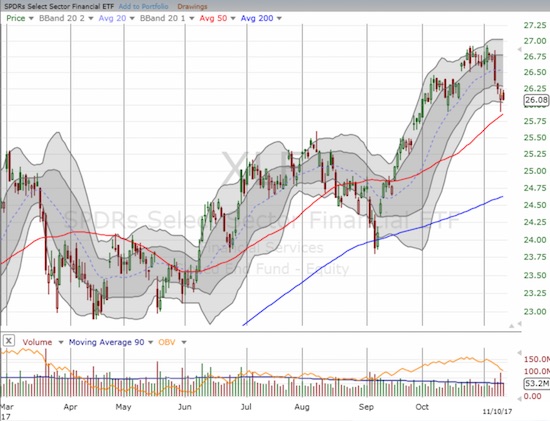
The Financial Select Sector SPDR ETF (XLF) sold-off sharply from its 10-year high. Will its 50DMA hold as support?
AT40 (T2108), the percentage of stocks trading above their respective 40DMAs, closed the week at 48.1% and a 2-month low. Its steady 5-week decline from overbought conditions closely matches the decline in IWM. AT200 (T2107), the percentage of stocks trading above their respective 200DMAs, also peaked in early October but has declined much less sharply. AT200 declined from 60.8% to 54.9%. This gentle slope helps explain why the major indices have yet to produce a major dip during the narrowing of the rally. While I was looking for the rally to start broadening last week, I am now thinking the current trends will continue absent a catalyst to produce significant buying interest.


Leave A Comment