AT40 = 63.5% of stocks are trading above their respective 40-day moving averages (DMAs) – ended 12 straight days overbought
AT200 = 58.8% of stocks are trading above their respective 200DMAs
VIX = 11.1
Short-term Trading Call: cautiously bullish (downgrade from bullish)
Commentary
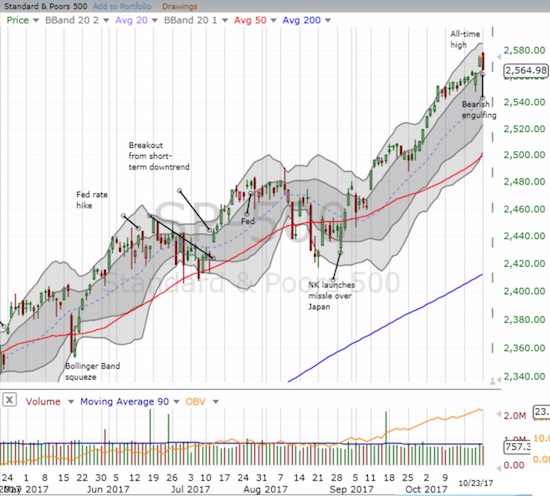
Just when I thought it was safe to stay bullish, the stock market took a notable turn southward.
The S&P 500 (SPY) lost just a fraction of a percent, but it was enough to reverse nearly the entire gain from Friday and produce a bearish engulfing pattern. In other words, the index flipped 180 form Friday’s bullish gap up and now wavers in the middle of a classic topping pattern.

The S&P 500 printed a potential topping pattern right after gapping up to an impressive all-time high.
The Nasdaq and the PowerShares QQQ ETF (QQQ) both lost 0.6% as they each pulled away from an all-time high or a near all-time high.
Importantly, the volatility index, the VIX, put on a rare display of strength. The VIX gained 11.1% AND held its high of the day; the volatility traders actually failed to show up. This behavior suggests higher VIX levels are coming soon (like this week).
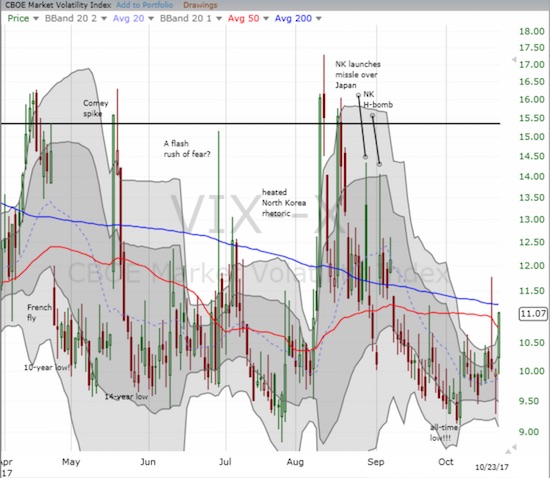
The volatility, the VIX, closed at a 6-week high.
The icing on the cake is AT40 (T2108), the percentage of stocks trading above their respective 40DMAs. My favorite technical indicator closed at 63.5%, a 1 month low. This move essentially confirms last week’s fall from overbought status…a confirmation of a bearish event.
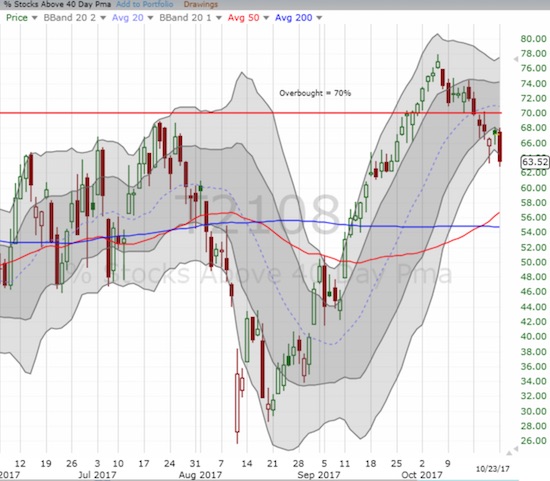
AT40 (T2108) confirmed resistance at the overbought threshold – a bearish turn of events.
All this action forced me to downgrade my short-term trading call. I hate to churn my trading call so quickly – witness my reluctance to downgrade my call when the overbought period ended. So I only went to cautiously bullish instead of neutral or cautiously bearish; I am wary that I would have to turn right around and upgrade once the stock market’s seasonally strong period begins sometime in November.


Leave A Comment