The next US central bank interest rate announcement is scheduled for tomorrow afternoon. Gold and related assets are now in “pause mode” against most fiat currencies.
Gold has a rough general tendency to decline ahead of a rate hike, and then rally strongly after a hike is announced.
That has happened in textbook fashion with the first three rate hikes in the current hiking cycle.
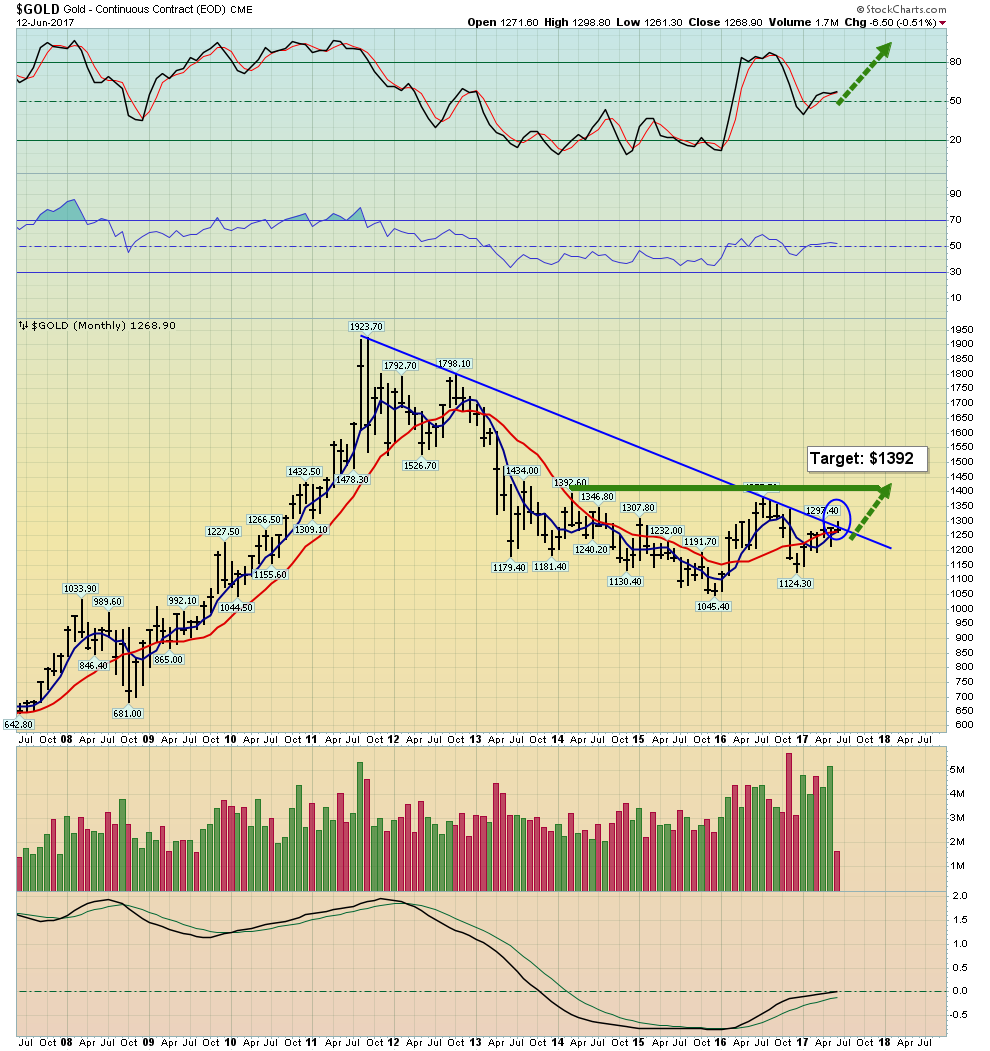
There’s no guarantee that it happens again this time, but if it does gold should take out the weekly chart downtrend line that has the attention of institutional technical analysts.
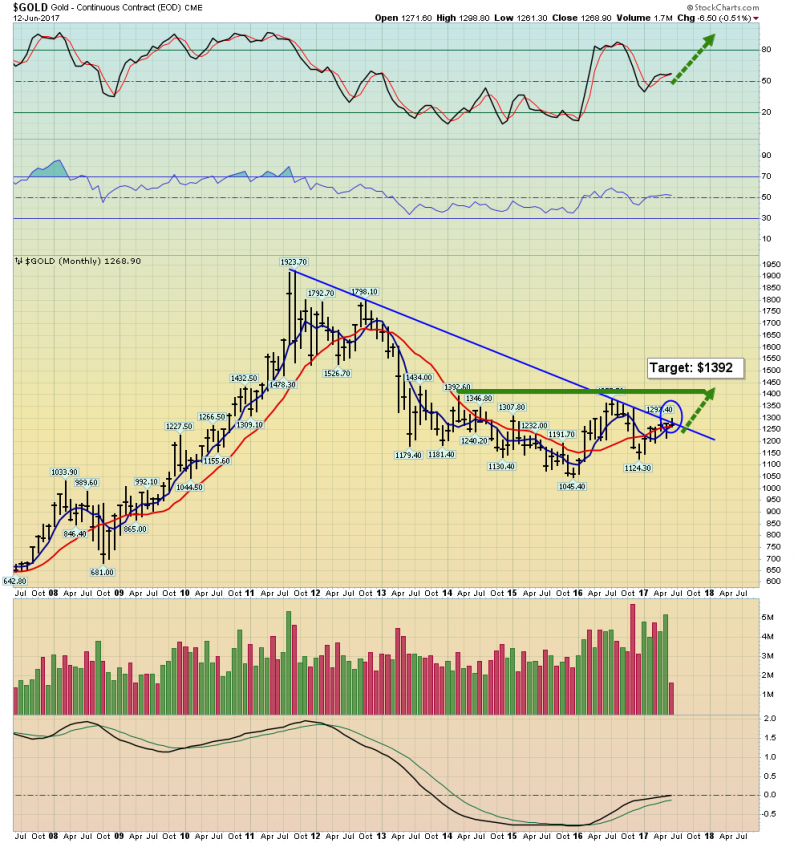
Double-click to enlarge this fabulous monthly gold chart.
Note the buy signal flashing on the Stochastics oscillator at the top of the chart. It’s happening in the 50 area, which indicates strong momentum.
Also, the TRIX indicator at the bottom of the chart is about to cross over the zero line. This is extremely positive technical action.
Technical breakouts that are produced by fundamentally important events are significant.
The bottom line is that a breakout on the monthly gold chart that occurs in the days following tomorrow’s Fed announcement could be a gamechanger for gold market investors.
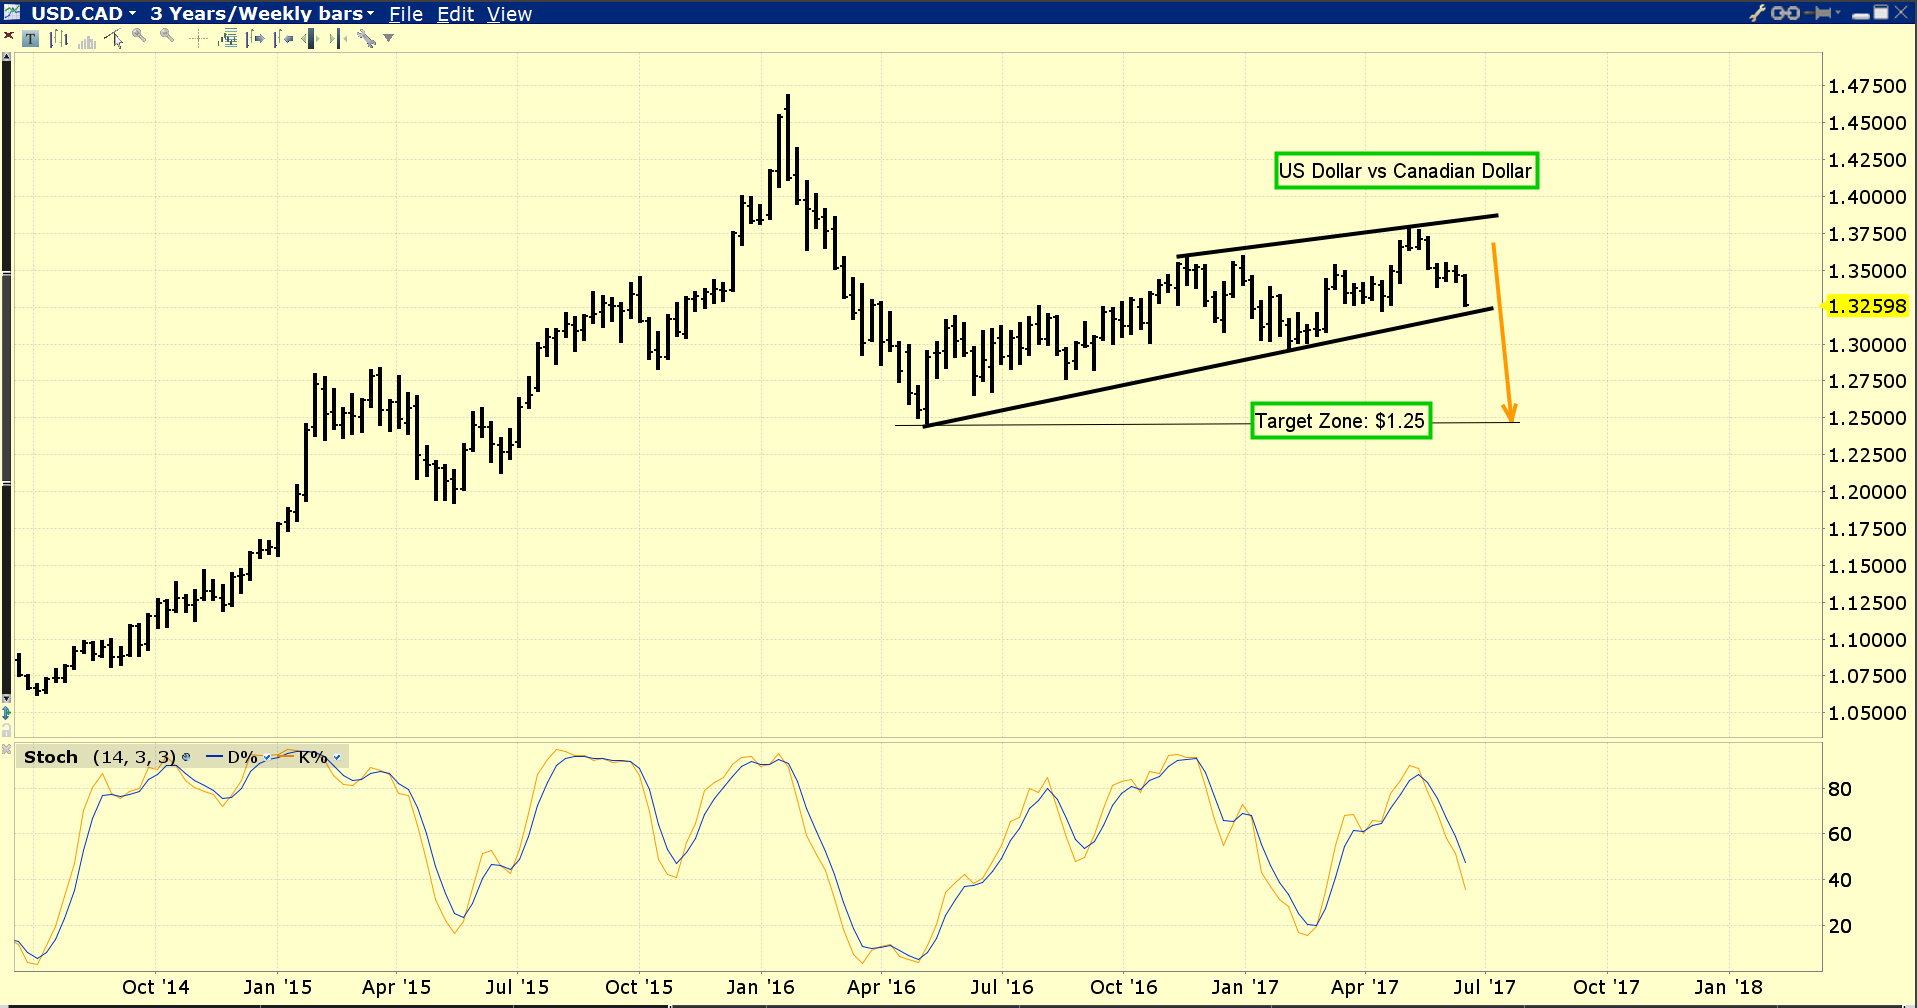
Double-click to enlarge this weekly chart of the US dollar versus the Canadian dollar.
The dollar already looks like a train wreck against both the Japanese Yen and the Indian rupee. Now it’s poised to go off the rails against the Canadian dollar. I’ve set an initial target zone in the $1.25 area.
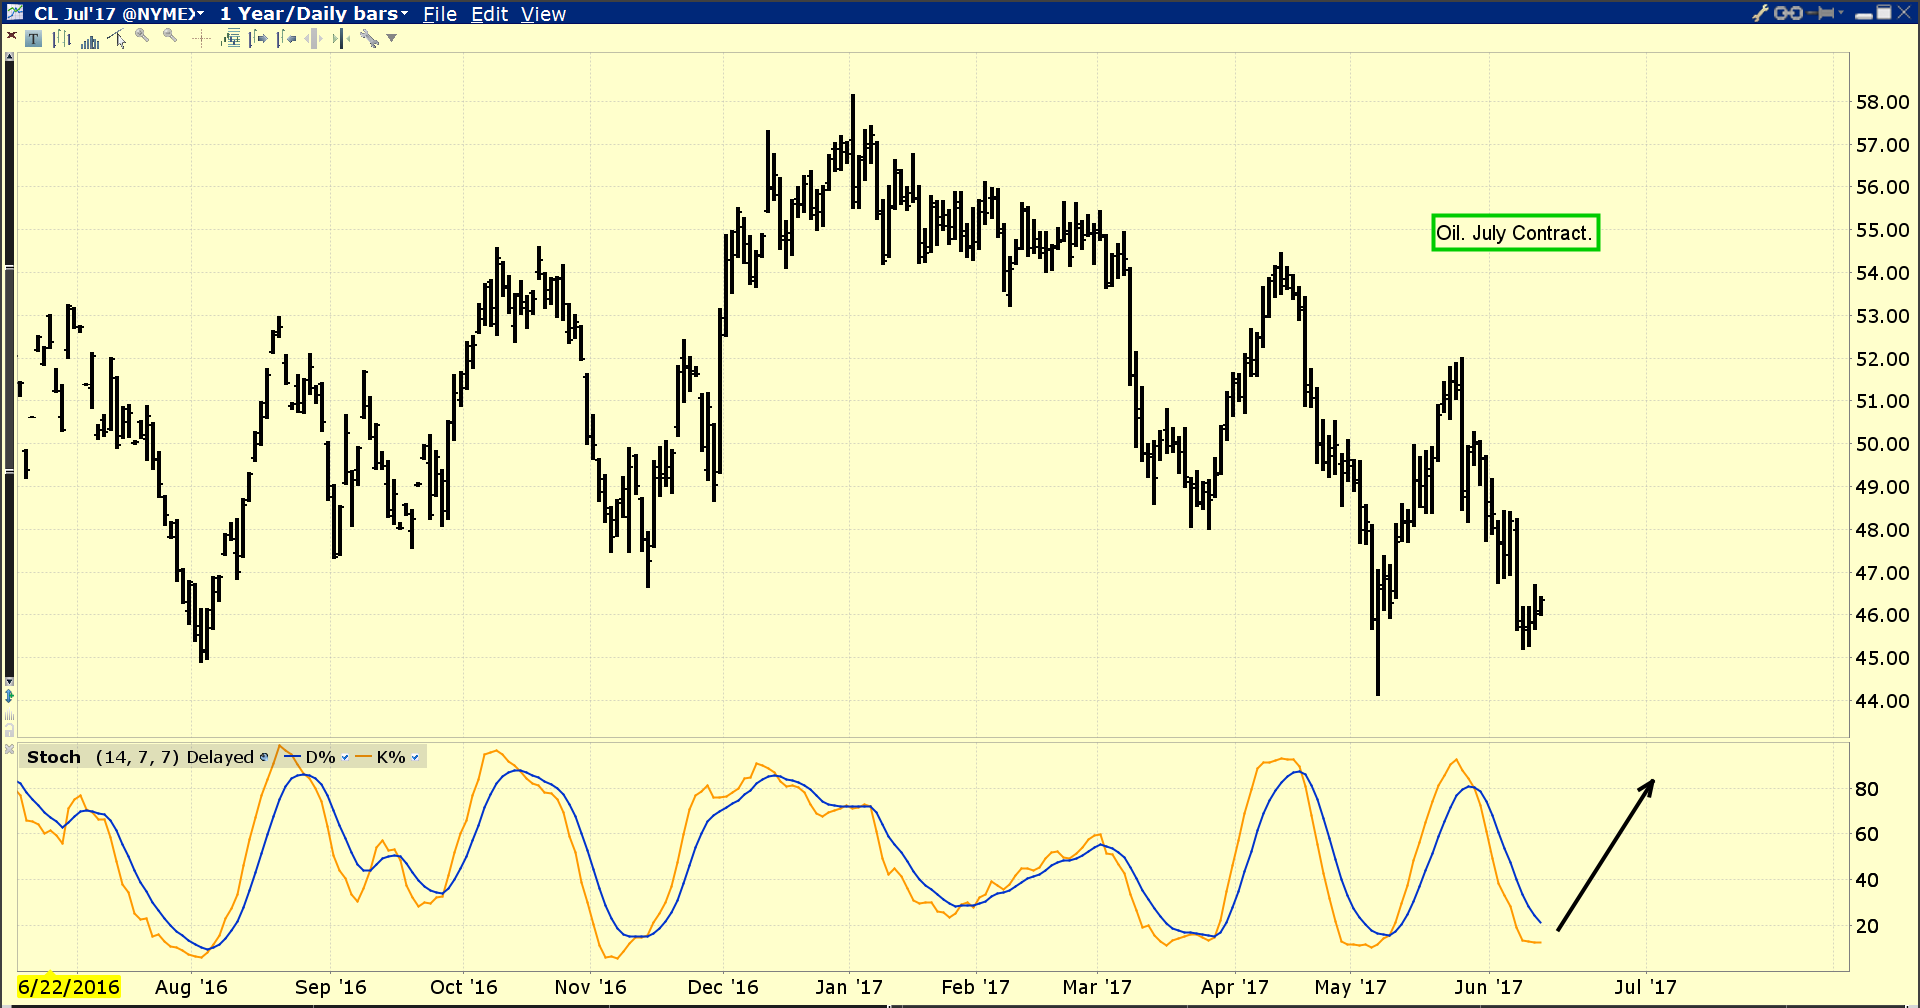
Double-click to enlarge this oil chart.
Oil is by far the largest component of the major commodity indexes. A rally in the Canadian dollar tends to coincide with a rally in those indexes.
That’s inflationary, and more good news for gold.

Good news for gold is happening around the world, and when it’s coming from India, commercial traders tend to buy long positions in size on the COMEX.


Leave A Comment