Stocks are rocketing to new highs almost every day. Jeff Bezos of Amazon.com (AMZN) saw his net worth exceed $100 billion. Bonds are still strong (and interest rates low). Real estate pricing is robust. DaVinci painting sells for $450 million. Bitcoin – having no intrinsic value other than a frenzy of speculative demand – trades above $11,000 (up from $1,000 on January 1), with surprising enthusiasm brewing among institutional investors, including some of the wealthiest and most successful, and with futures and derivatives on cryptocurrencies in the pipeline. (By the way, if you are afraid of a global internet crash disrupting your holdings, fear not, as there is a bitcoin satellite accessible by dish.)
Investors are desperately seeking the next hot area before it gets bid up. (Maybe marijuana stocks are next, in anticipation of broader legalization.) Indeed, central bank monetary policies have created significant asset inflation, with cheap money from around the globe burning a hole in investors’ pockets. So now it’s high time to invite to the party some of the huddled masses (who don’t have direct access to the Fed’s largesse) – through fiscal stimulus. We are already getting some of that in the form of regulatory reform, which the Administration has largely done on its own. But the eagerly anticipated big-hitter is tax reform, which requires the cooperation of Congress. And despite the Republicans’ inability to come to consensus on anything else, investors are already bidding up equities in anticipation of the House and Senate reconciling a tax bill that becomes law – so expect to see a big correction if it fails.
The promise of regulatory and tax reform have kept me positive all year on mid and small caps as the primary beneficiaries, and I remain so now more than ever. In addition, they offer a way to better leverage continued economic expansion and rising equity prices, particularly those that supply (or that seek to take away a small piece of a growing pie from) the dominant mega caps. Moreover, as the valuations for the mega-cap Technology names in particular grow ever more elevated, we are starting to see a passing of the baton to smaller players and other market segments that display more attractive forward valuation multiples.
In this periodic update, I give my view of the current market environment, offer a technical analysis of the S&P 500 chart, review Sabrient’s latest fundamentals-based SectorCast rankings of the ten US business sectors, and offer up some actionable ETF trading ideas. In summary, our sector rankings still look bullish, while the sector rotation model also maintains its bullish bias. A steady and improving global growth outlook and a persistently low interest rate environment continues to foster low volatility and an appetite for risk assets. Read on….
Market overview:
Yet another strong month. The S&P 500 was up +3.2% in November (its 8th consecutive positive month for the price index and 13th straight on a total return basis, considering dividends paid). The Dow was +4.0%, Nasdaq +2.6%, S&P Mid Cap 400 +4.2%, and S&P Small Cap 600 +3.7%. All sectors were positive for the month, with standouts like Banks (KRE) +4%, Oil & Gas Equipment (XES) +5%, Transportation (IYT) +5%…and Retail (XRT) up nearly +11%! Notably, the IYT gained +7% in just the last three days of the month! It is encouraging to see the transports finally attempt to catch up after lagging most of the year. Year-to-date through November 30, the S&P 500 (SPY) is +18%, while the Dow Jones (DIA) is +23%, Nasdaq 100 (QQQ) +31%, Nasdaq Composite +28%, S&P 400 mid caps +15%, and Russell 2000 small caps +14%. Among sectors, Technology (IYW) is still the leader at +38% while Telecom (IYZ) is the worst at about -13%. (Of note, Sabrient’s SectorCast model predicts this disparity to continue.)
And Sabrient’s GARP selection strategy has thrived in this market. YTD through December 1, all of Sabrient’s monthly Baker’s Dozen portfolios have outperformed the S&P 500 benchmark.
Economic reports continue to impress. Conference Board’s Index of Consumer Confidence climbed to 129.5, marking the highest level since November 2000. State Street Investor Confidence Index posted 97.1. Jobless claims fell to 238,000. Pending Home Sales report showed a robust 3.5% gain. Redbook retail sales showed YOY sales increased 4.8%. The Richmond Fed Manufacturing Index surged from 12 last month to 30, which was the highest since 1993. The BEA’s second estimate of real GDP in Q3 came in at 3.3%, and for Q4, the Atlanta Fed’s GDPNow model is forecasting 3.5% while the New York Fed’s Nowcast model says 3.9%. The AAII Sentiment Survey showed a 5.4% spike in bullish sentiment to 45.1%, which is a 9-month high. Of course, the budget deadline (and potential government shutdown) hits this week, on December 8, so we’ll have to see how that works out and any volatility it creates.
The CBOE Market Volatility Index (VIX), aka “fear gauge,” closed November at 11.28, after having registered a new intraday low of 8.56 on 11/24. Although investors are still wary that there hasn’t been a significant market correction since February 2016, complacency remains prevalent as VIX has not approached the 20 panic level in a very long time. Nevertheless, low volatility is the historical norm when economic growth is stable and positive, and it is further supported by the solid market breadth (particularly the participation of small caps), elevated performance dispersion among stocks, and lower sector correlations.
Breadth continues to hold up favorably, which is healthy (and indeed necessary) for the sustainability of the bull advance, Although the big mega-cap Tech names (e.g., FAAMG) likely will continue to attract investors, some rotation into smaller players and other market segments is a welcome development. For example, Wednesday brought about an interesting rotation out of Nasdaq and Technology and into Financial, Telecom, Transportation, Retail, and small caps. And then Thursday saw leadership from Energy and Industrial. The future for Financials is largely tied to regulation and interest rates, and the newly-nominated Fed Chair Jerome Powell has commented about unwinding some regulations for smaller banks and rewriting the Volcker rule.
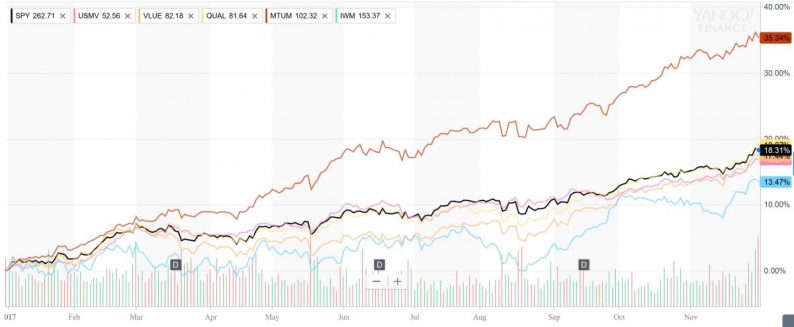
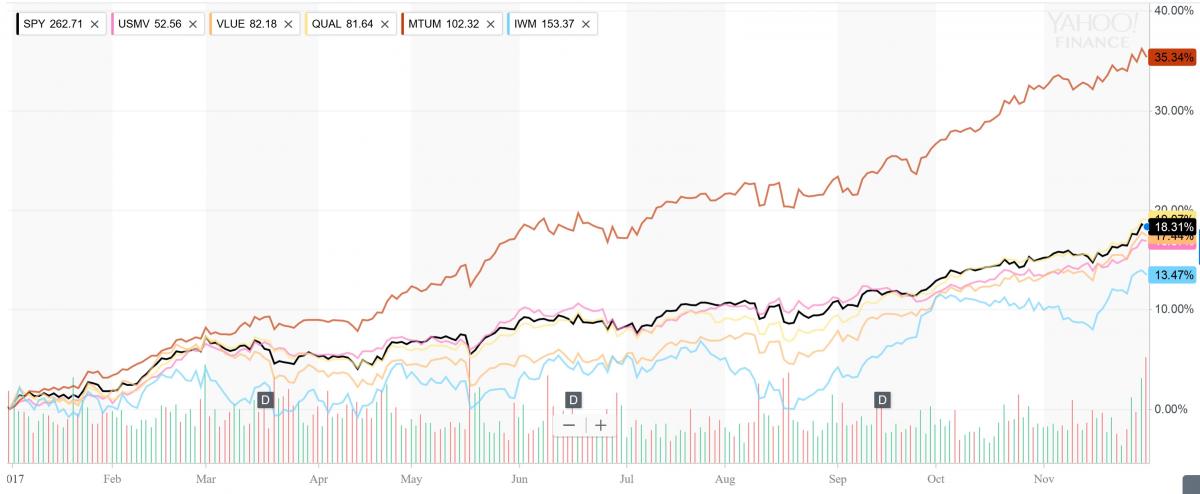
Overall, 2017 has been a year for Growth and Momentum over Value and Quality, as illustrated in the chart below showing a variety of iShares Edge MSCI factor ETFs plotted against the SPY. But after the market pulled back in mid-August, its initial recovery rally seemed to suggest a budding rotation into neglected market segments, including mids and smalls, as well as factors like Value, Low-volatility, and Quality. But then the Momentum factor quickly kicked back into gear for a while, until the last couple of weeks. Again, I firmly believe that a broadening into small caps and the Value and Quality factors is necessary if this bull market is going to be sustainable.
Value has underperformed Growth for most of the past decade. Even a storied Value investor like Warren Buffett has taken positions in growth-oriented Tech-sector names (with “wide moats”) like IBM (IBM) and Apple (AAPL), acknowledging that the impact and ubiquity of their services were far vaster than he ever imagined, penetrating the operations of all of Berkshire Hathaway’s (BRK-B) holdings. But this year has brought about the biggest divergence between Value and Growth since the final year of the dotcom bubble. Many market commentators have been arguing for years that Value is due for a major comeback, but market dynamics have been self-perpetuating. So many managed funds are chasing Momentum while passive funds either seek to replicate active buying or provide cap-weighted exposure that inherently rewards Growth over Value. Nevertheless, there has been a noticeable move into value-oriented strategies this year, especially through low-cost index funds. Year-to-date, U.S. large-cap value ETFs have attracted over $13 billion in net inflows.


Leave A Comment