Proximity Of Reversal
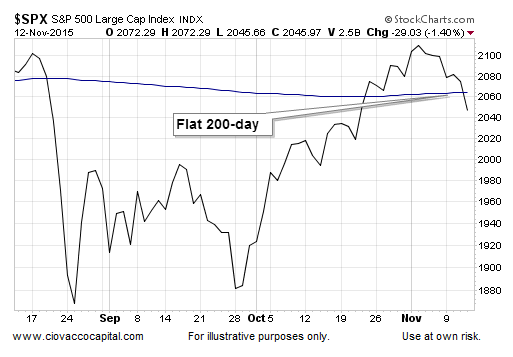
Today’s trading session opened some new doors of concern. For example, as shown in the chart below, the S&P 500 dropped back below its 200-day moving average. The flat look of the 200-day makes the cross back below even more relevant. Any sustained failure near the 200-day increases the odds related to the bear market scenario.

Possible Support
There was some rational basis for patience Thursday. As noted earlier this week via the tweet below, three levels have been respected by the market in recent months:
S&P 500: These levels have been noteworthy on a closing basis in the last seven months. pic.twitter.com/2vHLJ1bDNz
— Chris Ciovacco (@CiovaccoCapital) November 11, 2015
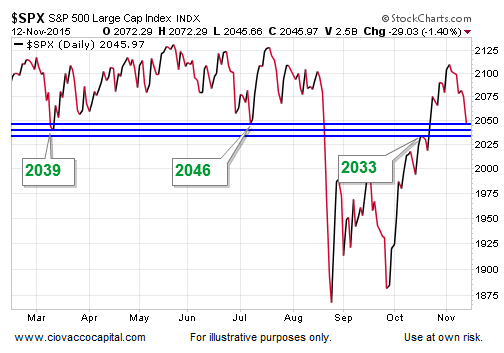
Below is an updated version of the chart tweeted on November 11th. The S&P 500 closed at 2045.97 Thursday, or just under 2046. These levels represent “possible support”, meaning they could hold or price may decide it wants to head toward 2020.
How Relevant Is This Week?
It is too early to read too much into this week’s pullback, especially given Friday’s session is still on the weekly agenda. However, the area of the reversal (near the 200-day) tells us to keep an open mind about all outcomes (even the most bearish).
Given the market’s profile and since we were allocated in line with the model as of last Friday, we prefer to see how things look at 4:00 pm this Friday relative to the model, rules, and our allocations. In terms of the levels above, 2046 and 2039 are more important than 2033. As always, if some adjustments need to be made to our portfolios, we will not hesitate to make them.
All Three Scenarios Must Be Respected
With price back below a flat 200-day, all three scenarios below become much more relevant:


Leave A Comment