It’s Thanksgiving Week 2017, and here at Political Calculations, that means that we’ll be devoting the whole week to exploring the centerpiece of this uniquely American holiday in keeping with our annual traditions.
But that doesn’t mean that we won’t be discussing things like the stock market either – we’ll just be loading it up with a healthy serving of Thanksgiving turkey.
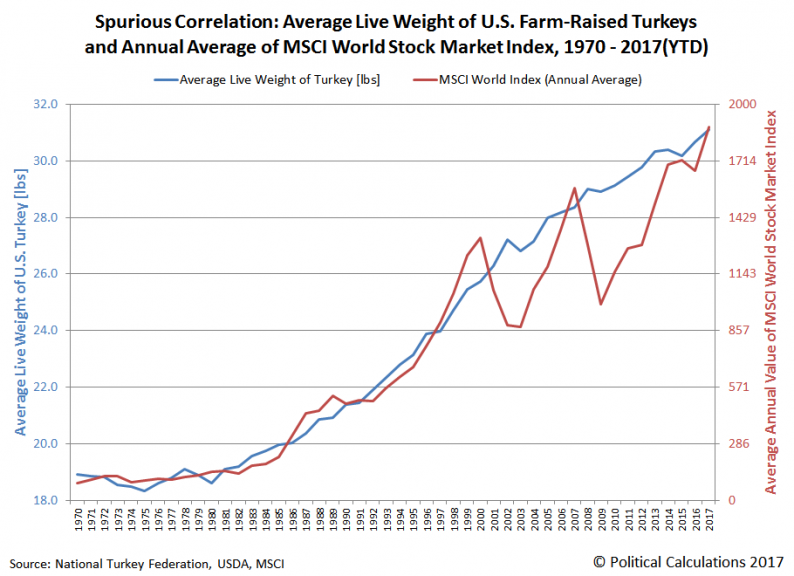
Let’s get started by doing just that, where we’ll update the chart showing our favorite spurious correlation of all time – the apparent relationship that exists between the average live weight of U.S. farm-raised turkeys and world stock prices. The following chart updates that relationship through this point of time in 2017!

If you’re the type of person who believes that they can divine the future from any synchronous patterns you identify on charts showing apparently strongly correlated data like this – and the correlation here is indeed strong with an R² of 0.9717 – you should be very worried about the potential for a stock market crash in the near term, seeing as the chart shows that every time that the MSCI world stock index has risen higher than the proportionately scaled average live weight of U.S. farm-raised turkeys, a major correction hasn’t been far behind.
We’ll also tell you that even after detrending the data to account for the rising linear trends for both data series, the correlation doesn’t disappear as you might suspect would happen for a fully spurious correlation. Instead, the R² drops to 0.5315, which might be considered to be a moderately-strong correlation.
And yet, we’re happy to confirm that the apparent correlation is genuinely spurious. It’s total garbage – the growth of the average weight of turkeys raised on farms in the U.S. is not, in any way that we can identify, connected to the growth of global stock prices.


Leave A Comment