Market Overview
This is the question that all analysts are asking after last week’s performance. My own interpretation is that we are not – yet! Friday’s decline (which could come to an end next week) only needs a few more points on the downside to have retraced 50% of the move from 1872. In spite of all the scary price decline, this can only be labeled (so far) as a normal correction of the last uptrend. The market will tip its hand on the next rally from this level. If it fails to develop some real strength and turns down decisively before surpassing 2070, the odds will increase that a bear market has started. The confirmation will come when we break below the low that we are in the process of making.
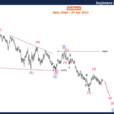
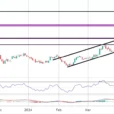
I have maintained ever since the initial decline in August that, based on the amount of distribution that was made before and after we reached the 2135 peak, that this would most likely be the high point of the bull market. Our inability to get through that resistance band on the last rally, and the current weakness have enhanced this probability, but it has not yet confirmed it. However, somewhat of a confirmation has occurred since the 2116 top was made. The amount of distribution which has taken place since that top on the 3X P&F chart, confirms exactly the amount of distribution which took place in the second phase of the top distribution pattern. (The first phase projected a move down to 1863. The August low occurred at 1868 – close enough!) If we can trust the projection indicated by the second phase of distribution, the current downtrend move should not stop at a 50% retracement, but go much lower, thereby confirming that we are in a bear market. (The first and second phases of distribution are clearly marked on the daily chart, below.)
Even if we are not yet in a bear market and we start another uptrend from here, we are in the last phase of the bull market which will come to an end when this phase is completed whether or not we make a new high in the SPX.


Leave A Comment