The good news is that the economy just printed its second consecutive quarter of 3% growth, a feat not accomplished since Q2 and Q3 2014. The bad news is that the growth spurt in 2014 was better, quantitatively and qualitatively. Those two quarters produced gains of 4.6% and 5.2% (annualized) in GDP, much better than the most recent 3.1% and 3% prints of Q2 and Q3 2017. And it took a hurricane to get the most recent quarter up to the 3% level, an event, as a South Florida resident, I surely hope isn’t repeated any time soon. Further bad news can be found in the period immediately after that 2014 spurt as quarterly growth fell to 0.5% by Q4 2015; the spurt was just that and did not produce a sustainable change in the overall trajectory of the economy. I see no reason to expect this episode to end any differently.
It probably can’t be emphasized enough to investors that the quarter to quarter or month to month changes we see in the economic data are so much noise and tell us very little. Through the course of a business cycle we can have several slowdowns and accelerations that turn out to be nothing more than that, short term changes in the first or second derivative. That’s why we so often look at year over year data and even longer periods to get a sense of what is really going on. The most recent durable goods orders report is a great example (and these ups and downs are much more pronounced in the goods side of the economy).
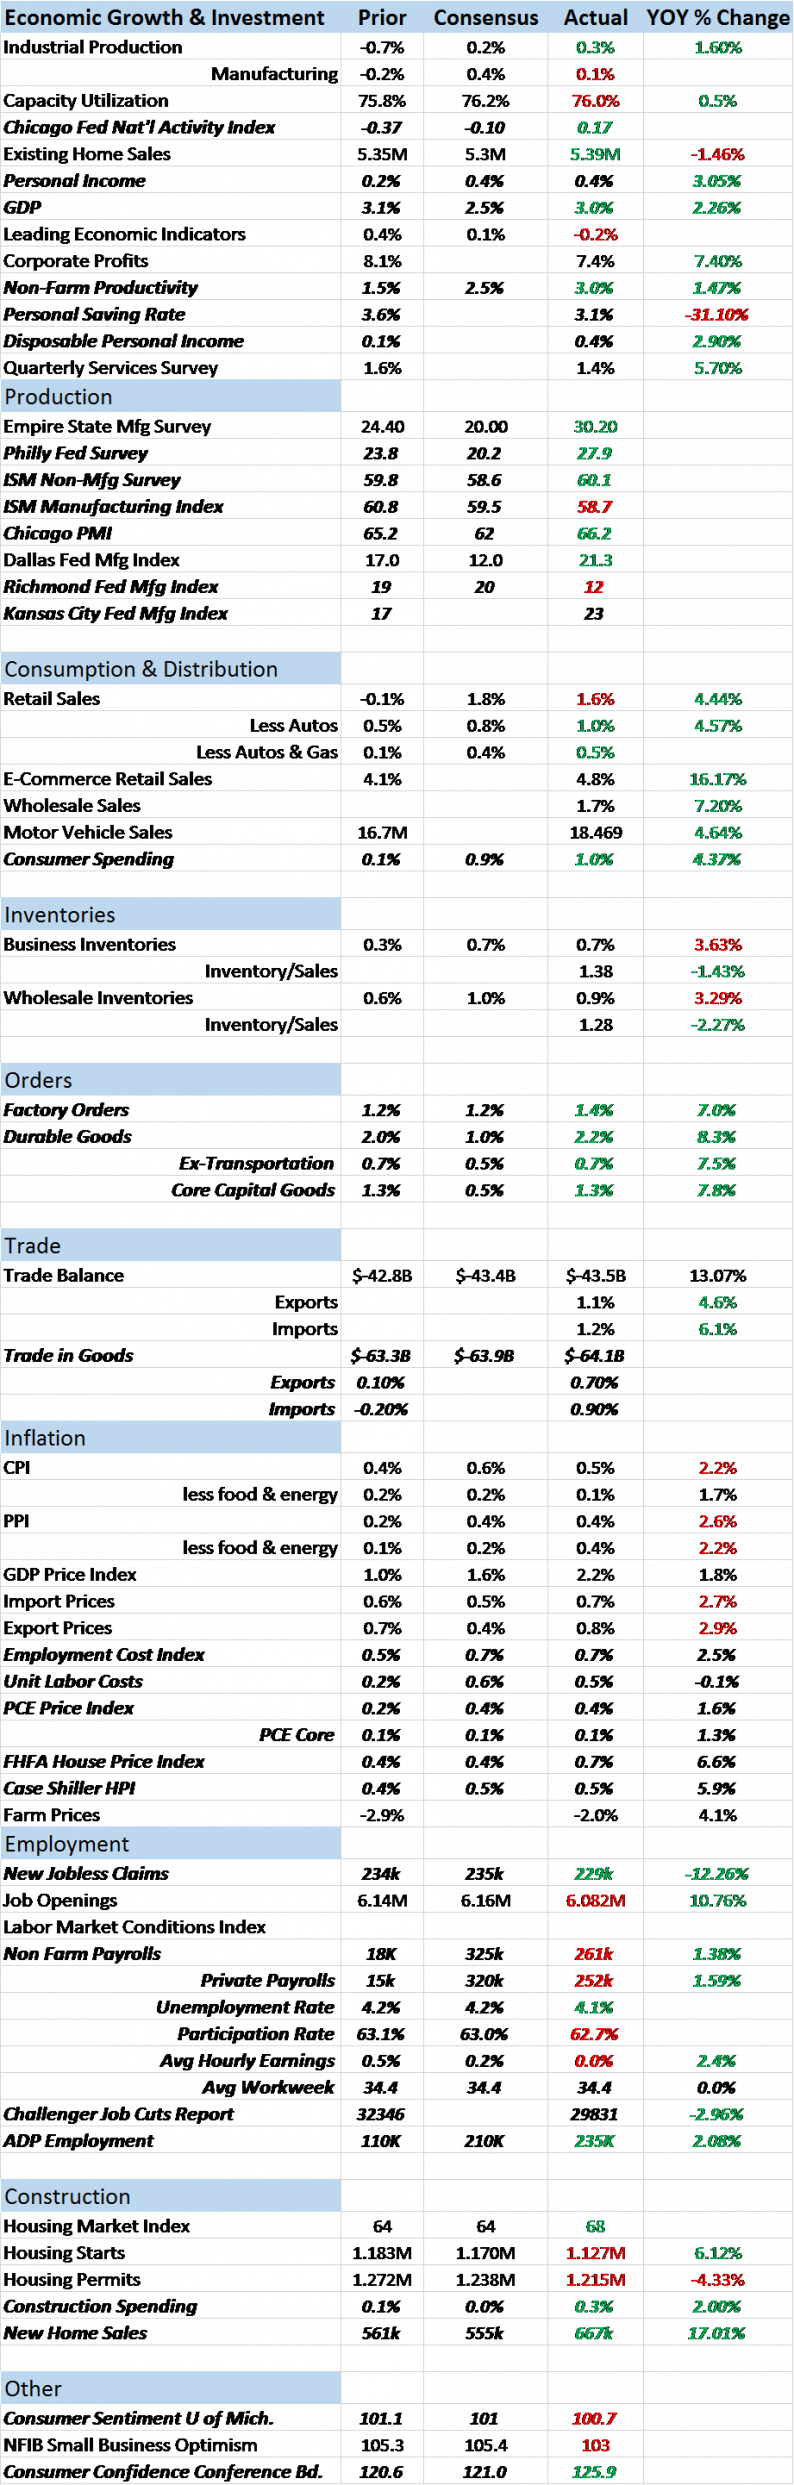
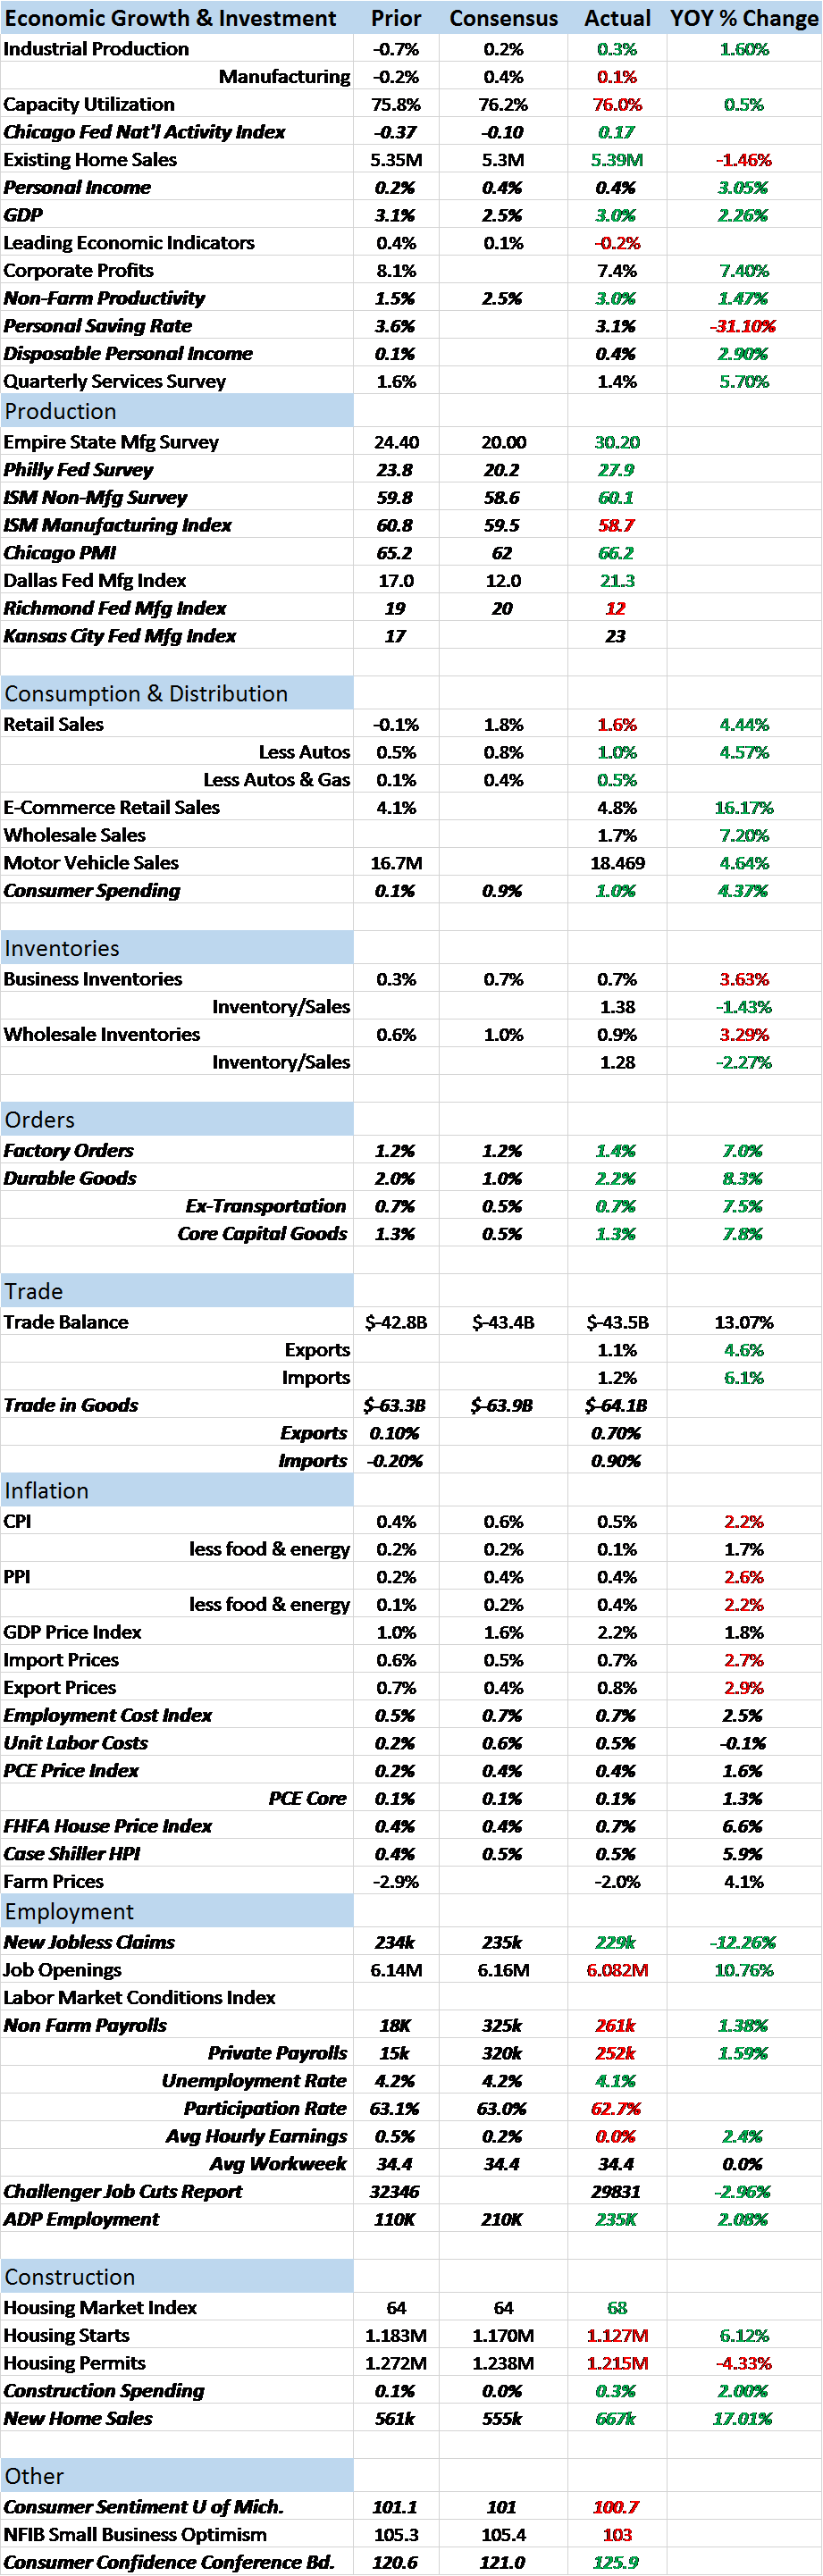
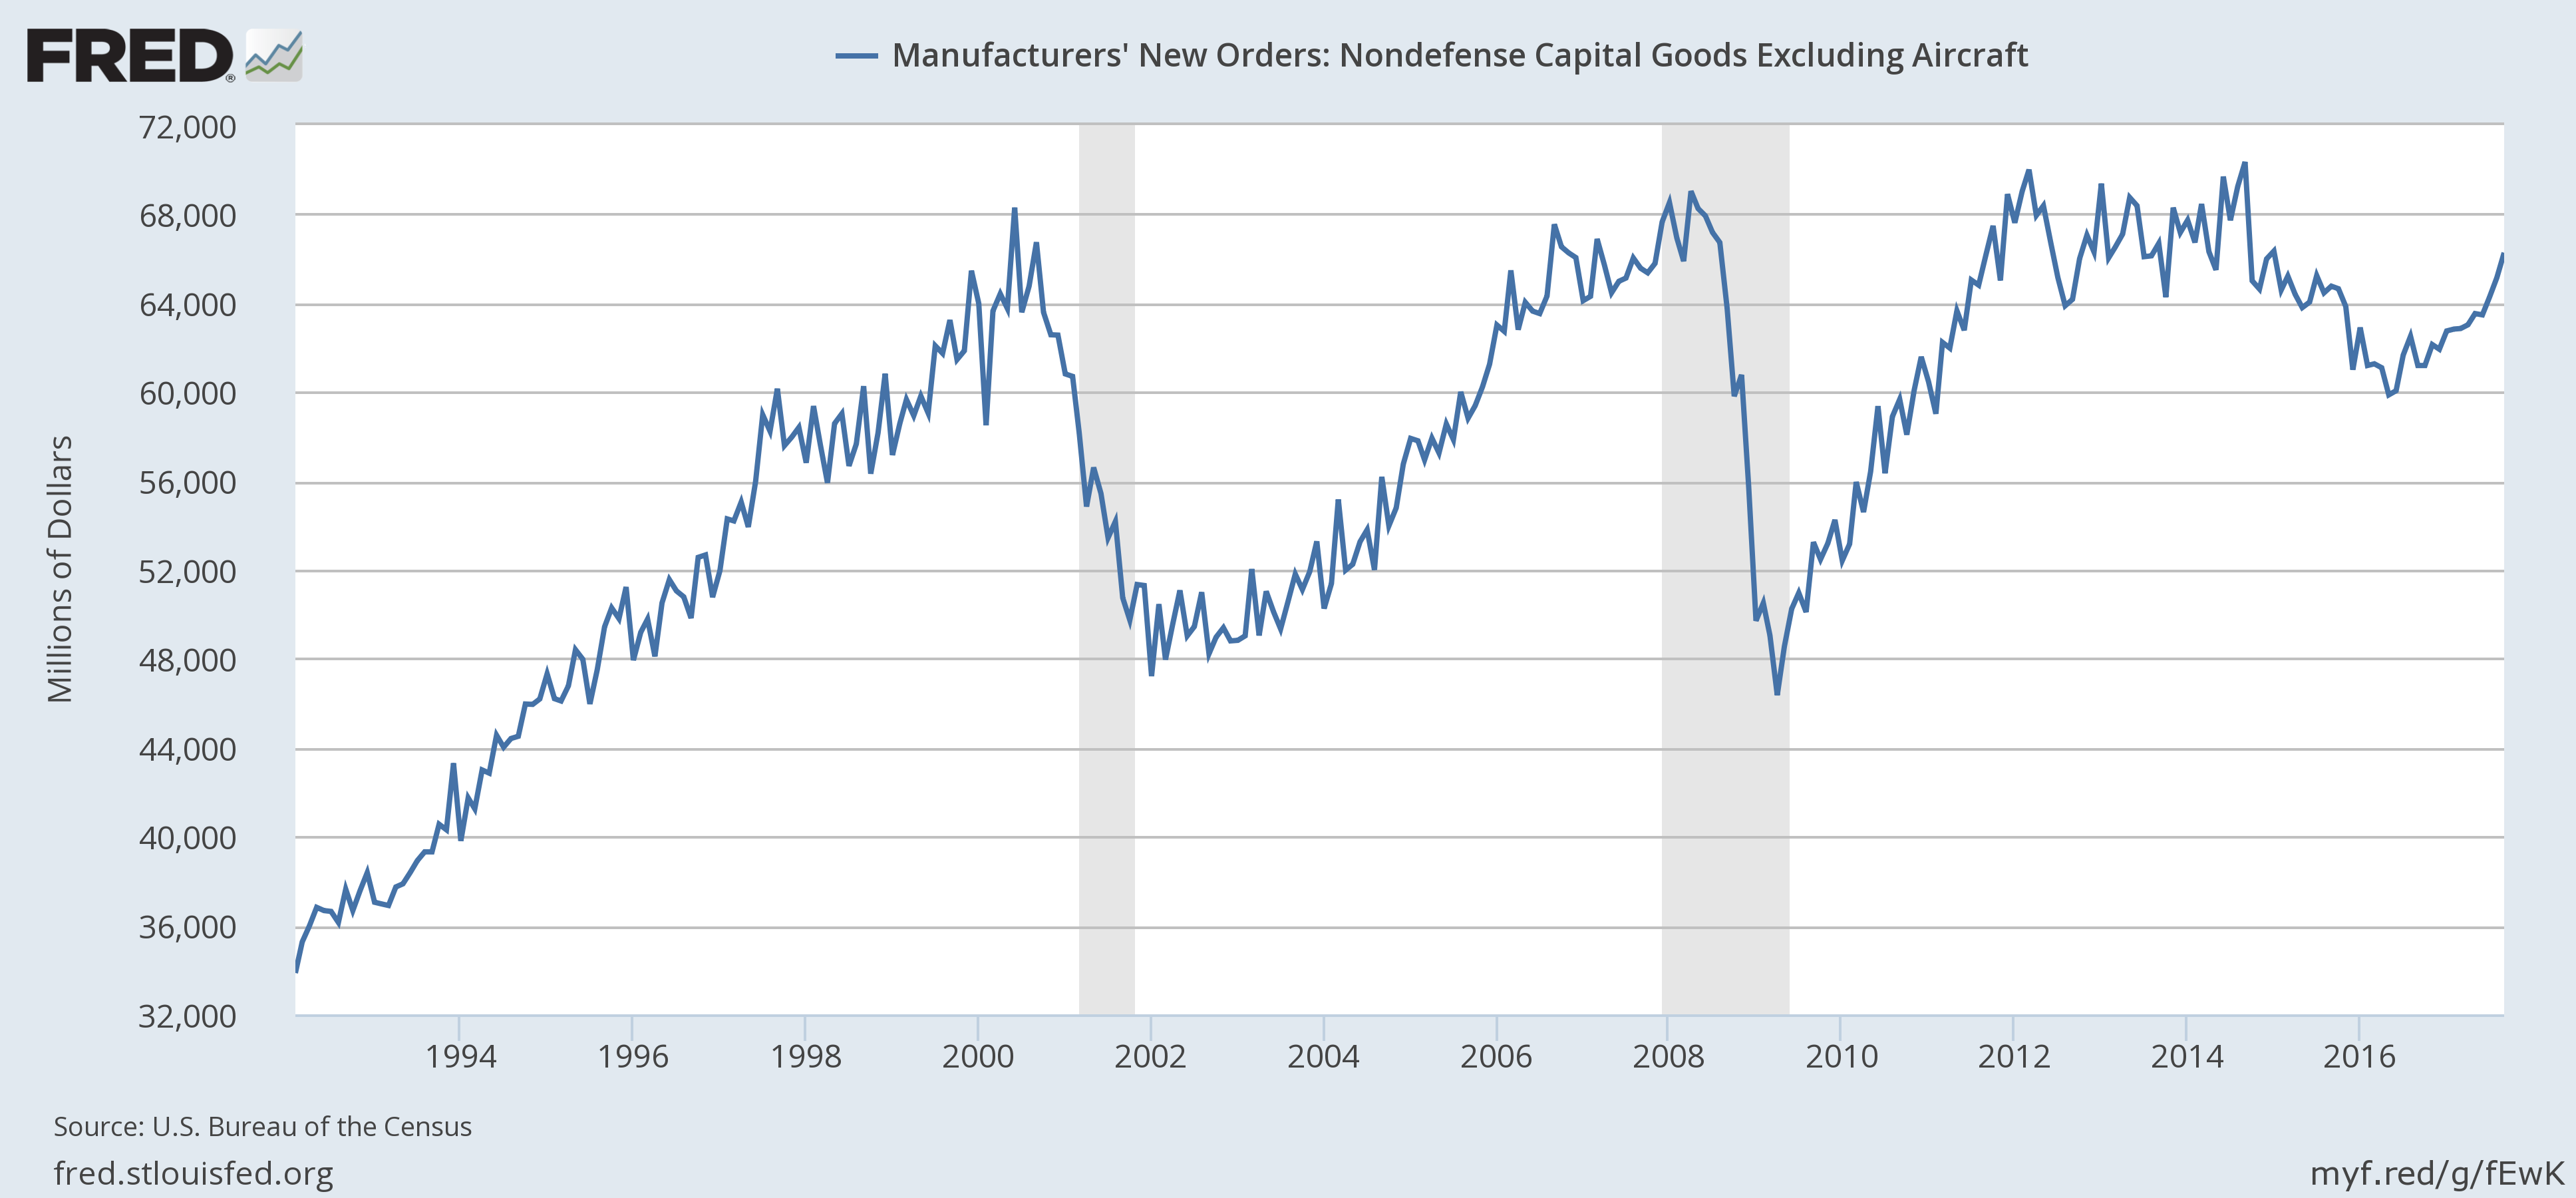
Durable goods orders were reported to be up 2.2% month over month and 8.3% year over year (both figures seasonally adjusted). In isolation those sound like solid growth rates and reason for celebration – the economy is finally breaking out of the new normal! – until you zoom out and realize that the level of orders is about the same as November of 2013, a full 4 years ago. And by the way, not significantly different than July of 2007 and only about 20% higher than the beginning of the fourth quarter…..of 2000, seventeen years ago. Now, it may well be that this is the beginning of a more sustained uptrend but you certainly can’t make that claim from the data we have today.
There are plenty of other metrics that show a similar trajectory. Core capital goods orders – a slice of the durable goods report – are no higher today than late 2000. Exports and imports are both up 4.6% and 6.1% year over year and yet less than March of 2014. Housing starts are up 6.1% year over year but less than November of 2013. New home sales are in an uptrend since the low in 2011 but are only now back to the levels that prevailed in late 2007 just before the last recession. Construction spending is also in an uptrend since 2011 but only recently surpassed the previous cycle peak in 2006.
As I said above, it may be that these recent uptrends are finally the ones we’ve been waiting for this entire cycle, the beginning of a sustained level of growth more like what we’ve experienced in previous cycles. But if that is true, much of the capital markets aren’t buying it. Our indicators point to, at best, a continuation of the 2% growth path we’ve been on for the last 4 years. Stocks are the outlier, anticipating a future other markets don’t see. I don’t know if that is a function of hyped expectations for Trump administration economic reforms or just the same old TINA (there is no alternative…to stocks) but in either case I question how much longer it can last.


Leave A Comment